
Development of mountain wind power in China significantly reduces ecosystem resistance to soil water erosion
-

-
REFERENCES
[1] Wang Q., Luo K., Yuan R. et al. (2020). A multiscale numerical framework coupled with control strategies for simulating a wind farm in complex terrain. Energy 203:117913. DOI:10.1016/j.energy.2020.117913 [2] Gao X.,Wang T., Li B. et al. (2019). Investigation of wind turbine performance coupling wake and topography effects based on LiDAR measurements and SCADA data. Appl. Energ. 255: 113816. DOI: 10.1016/j.apenergy.2019.113816 [3] Ma B., Yang J., Chen X. et al. (2023). Revealing the ecological impact of low-speed mountain wind power on vegetation and soil erosion in South China: A case study of a typical wind farm in Yunnan. J. Clean. Prod. 419:138020. DOI:10.1016/j.jclepro.2023.138020 [4] Wu Y., Liao M., Hu M. et al. (2020). A decision framework of low-speed wind farm projects in hilly areas based on DEMATEL-entropy-TODIM method from the sustainability perspective: A case in China. Energy 213:119014. DOI:10.1016/j.energy.2020.119014 [5] Zhang C., Li X., Lyu X. et al. (2025). Impact of mountain wind farms on different vegetation types: A case study in Yunnan Province. Environ. Sustain. Ind. 28: 100873 (2025). DOI: 10.1016/j.indic.2025.100873 [6] Xia Z., Li Y., Guo S. et al. (2025). Assessment of forest disturbance and soil erosion in wind farm project using satellite observations. Resour. Conserv. Recy. 212:107934. DOI:10.1016/j.resconrec.2024.107934 [7] Yan J., Wang S., Feng J. et al. (2025). New 30-m resolution dataset reveals declining soil erosion with regional increases across Chinese mainland (1990–2022). Remote Sens. Environ. 323:114681. DOI:10.1016/j.rse.2025.114681 [8] Liu Y., Fu B., Liu Y. et al. (2019). Vulnerability assessment of the global water erosion tendency: Vegetation greening can partly offset increasing rainfall stress. Land Degrad. Dev. 30:1061−1069. DOI:10.1002/ldr.3293 [9] Wang H., Zhao W., Li C. et al. (2021). Vegetation greening partly offsets the water erosion risk in China from 1999 to 2018. Geoderma 401:115319. DOI:10.1016/j.geoderma.2021.115319 [10] Tarolli P. Liu G., Castelli G. et al. (2026). Nature-based solutions for soil and water conservation in an era of climate extremes: Limitations and future scenarios. Int. Soil Water Conse. 14:100604. DOI:10.1016/j.iswcr.2025.12.004 -
ABOUT THIS ARTICLE
Cite this article:
Lyu X., Li X., Dang D., et al. (2026). Development of mountain wind power in China significantly reduces ecosystem resistance to soil water erosion. The Innovation Energy 3:100197. https://doi.org/10.59717/j.xinn-energy.2026.100197
Welcome!
To request copyright permission to republish or share portions of our works, please visit Copyright Clearance Center's (CCC) Marketplace website at marketplace.copyright.com.
Export File
Citation
Lyu X., Li X., Dang D., et al. (2026). Development of mountain wind power in China significantly reduces ecosystem resistance to soil water erosion. The Innovation Energy 3:100197. https://doi.org/10.59717/j.xinn-energy.2026.100197

Format
Content
 DownLoad:
-
Figure 1.
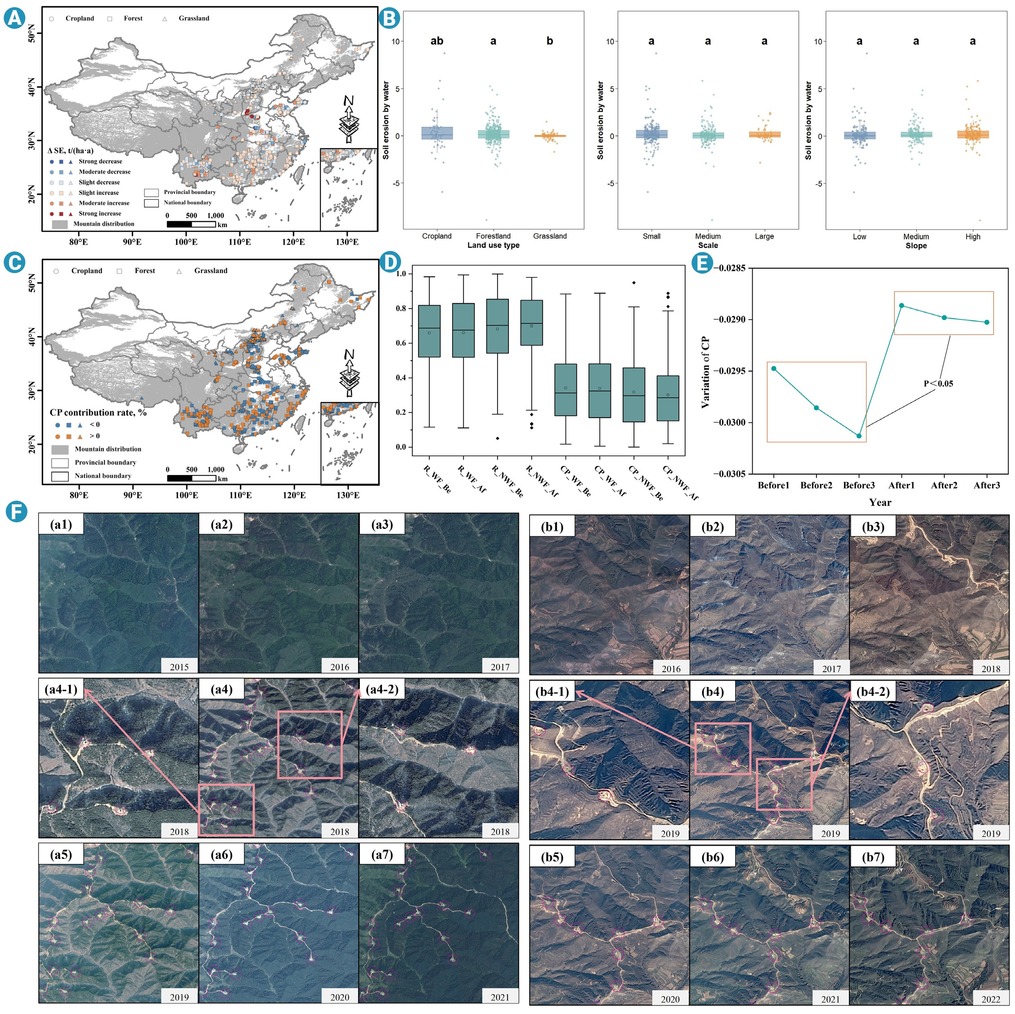
(A) Impacts of mountainous wind farms on soil water erosion (Δ SE, t ha-1 yr-1), classified using the natural breaks method into strong decrease (−8.95 to −5.96), moderate decrease (−3.26 to −1.20), slight decrease (−1.11 to <0), slight increase (>0 to 1.11), moderate increase (1.16 to 3.08), and strong increase (3.84 to 8.72), and the different symbols represent the land cover types of the wind farms; (B) comparative analysis of soil water erosion among different categories of mountainous wind farms; (C) changes in the relative contribution rate of the ecosystem resistance factor CP attributable to the construction and operation of mountainous wind farms (the different symbols indicate the land cover types of the corresponding wind farms); (D) changes in the contribution rates of the environmental stress factor R and the ecosystem resistance factor CP between wind farm areas and control areas; (E) changes in the difference in the ecosystem resistance factor CP between wind farm areas and control areas over three years before and after construction; (F) high-resolution GF-2 true-color imagery showing two wind farms with severe soil erosion before and after construction (the local inset panels provide magnified views to clearly mark the wind power construction areas, while the main panels preserve the overall landscape context). The test in (B) is the Kruskal-Wallis test. The test in (D) is the Wilcoxon signed-rank test. The lines indicate the median (50th percentile), with boxes showing the first (Q1, 25th percentile) and third (Q3, 75th percentile) quartiles. Whiskers extend to Q1 − 1.5 × IQR and Q3 + 1.5 × IQR. The test in (E) is the Wilcoxon signed-rank test. All statistical tests were performed using IBM SPSS Statistics 26 software.
