
Cross-border emissions in the service sector: A global analysis of environmental and economic linkages
-
GRAPHICAL ABSTRACT
 DownLoad:
Full size image
DownLoad:
Full size image
-
PUBLIC SUMMARY
-
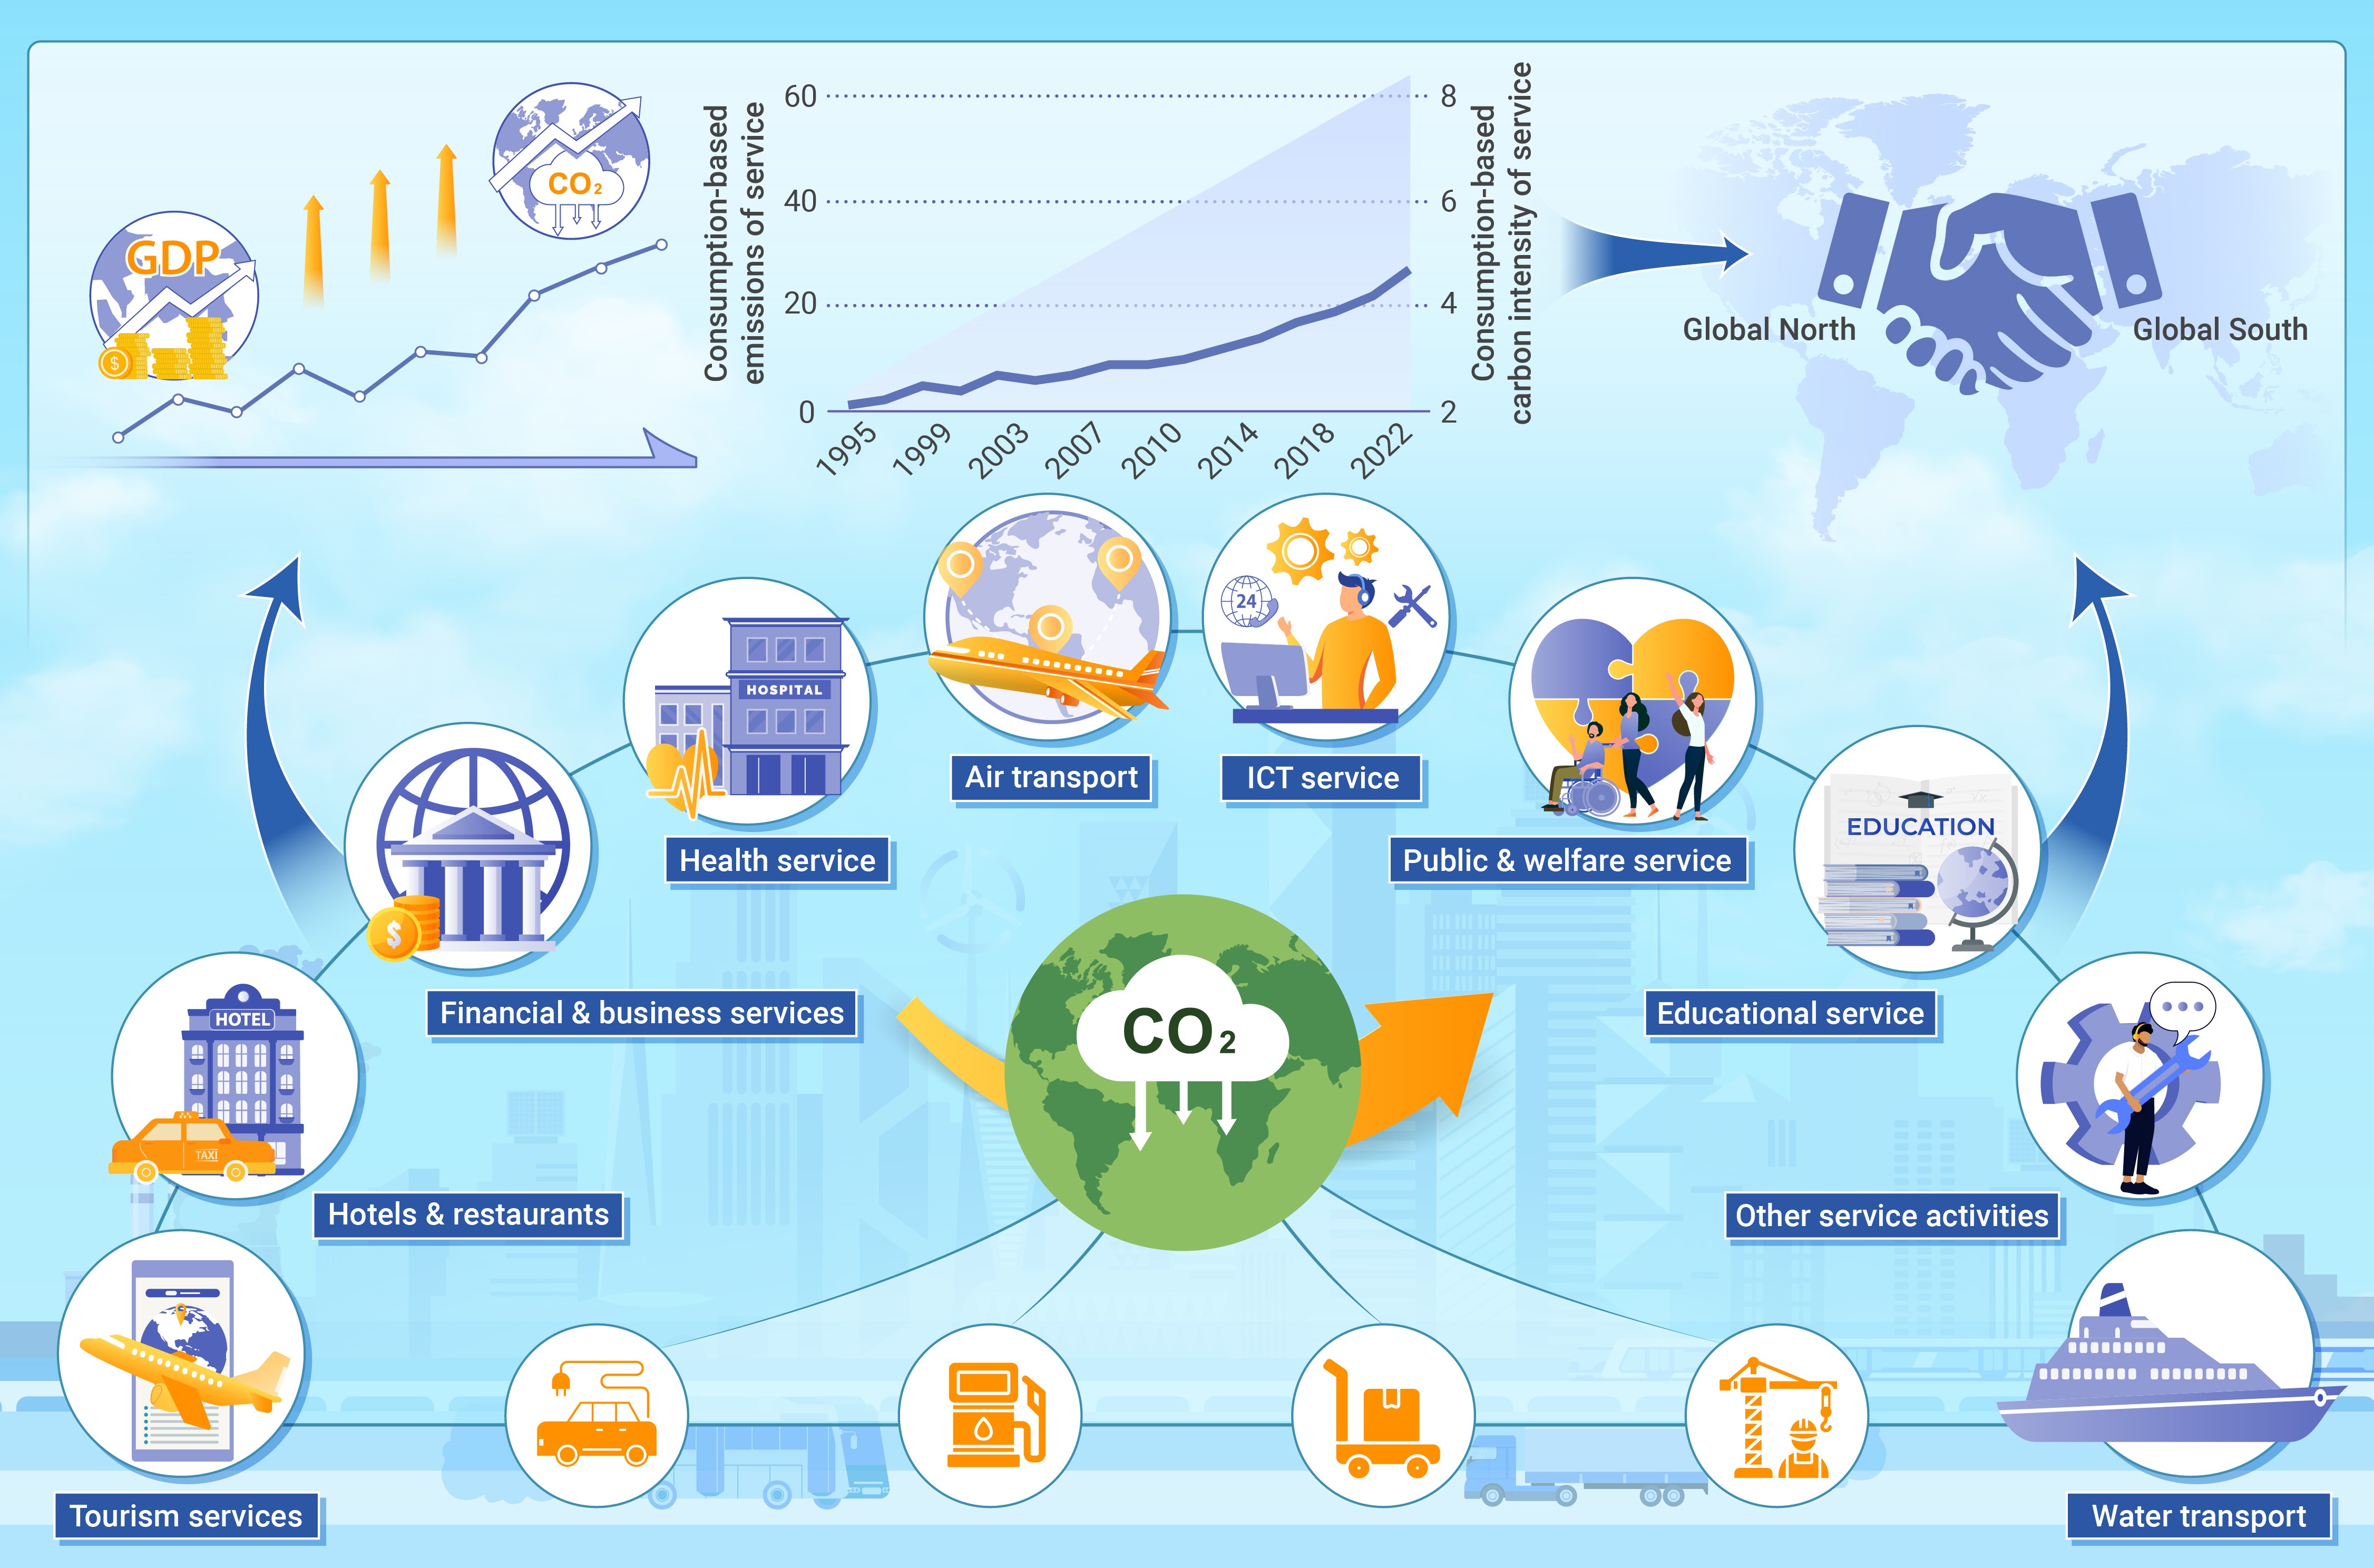
The service sector caused 63% of consumption emissions rise, led by public, health, and financial services.
Developed nations are net importers of service-related emissions, while developing ones are net exporters.
Enhancing efficiency and green-tech investment in high-impact service sectors are key for cutting emissions.
-
-
ABSTRACT
The global service industry, commonly perceived as low-carbon, is in fact a significant driver of emissions growth. Yet, traditional emission-accounting-based assessments have overlooked the transmission pathways of emissions in the service industry across regions, thereby making it difficult to uncover its dynamic and complex spatial and industrial interconnections. This study addresses this gap by using multi-regional input-output (MRIO) analysis and structural path decomposition (SPD) to examine consumption-based emissions (CBE) in the service sector across multiple countries from 1995 to 2021, offering new insights for targeted mitigation strategies. Results reveal a steady 63% increase in the global CBE of services, primarily driven by the expansion in public, health, and financial services. While developed countries are net importers of embodied emissions in services, developing nations largely serve as net exporters, with transportation—especially air and water transport—contributing significantly to carbon intensity. China, the United States, and Japan emerge as the top service-sector emitters, highlighting the critical role of both direct and complex intermediate inputs in driving emissions. The study underscores the need for efficiency improvements and green technological investments, particularly in transport and high-impact service sectors, to mitigate emissions while supporting service sector growth. These findings offer insights for policymakers on prioritizing sector-specific and cross-border strategies to achieve sustainable development in the global service industry. -

-
REFERENCES
[1] Buckley P. and Majumdar R. (2018). The services powerhouse: Increasingly vital to world economic growth. Deloitte Insights, 12:1-20. https://www2.deloitte.com/content/dam/Deloitte/my/Documents/risk/my-risk-sdg8-the-services-powerhouse-increasingly-vital-to-world-economic-growth.pdf. [2] Xing R., Hanaoka T., Kanamori Y., et al. (2018). Estimating energy service demand and CO2 emissions in the Chinese service sector at provincial level up to 2030. Resour. Conserv. Recy. 134:347−360. DOI:10.1016/j.resconrec.2018.02.030 [3] Zhang W., Peng S. and Sun C. (2015). CO2 emissions in the global supply chains of services: an analysis based on a multi-regional input–output model. Energ. Policy. 86:93−103. DOI:10.1016/j.enpol.2015.06.029 [4] Belousova V., Bondarenko O., Chichkanov N., et al. (2022). Coping with greenhouse gas emissions: Insights from digital business services. Energies 15:2745. DOI:10.3390/en15082745 [5] Dong Y., Coleman M. and Miller S A. (2021). Greenhouse gas emissions from air conditioning and refrigeration service expansion in developing countries. Annu. Rev. Env. Resour. 46:59−83. DOI:10.1146/annurev-environ-012220-034103 [6] Roberts S H., Foran B D., Axon C J., et al. (2021). Is the service industry really low-carbon. Energy, jobs and realistic country GHG emissions reductions. Appl. Energ. 292:116878. DOI:10.1016/j.apenergy.2021.116878 [7] Bergero C., Gosnell G., Gielen D., et al. (2023). Pathways to net-zero emissions from aviation. Nat. Sustain. 6:404−414. DOI:10.1038/s41893-022-01046-9 [8] Sun Y., Qian L. and Liu Z. (2022). The carbon emissions level of China’s service industry: An analysis of characteristics and influencing factors. Environ. Dev. Sustain. 24:13557−13582. DOI:10.1007/s10668-021-02001-y [9] Su B., Ang B W. and Li Y. (2017). Input-output and structural decomposition analysis of Singapore's carbon emissions. Energ. Policy 105:484−492. DOI:10.1016/j.enpol.2017.03.027 [10] Zhang Y., Bian X., Tan W., et al. (2017). The indirect energy consumption and CO2 emission caused by household consumption in China: an analysis based on the input–output method. J. Clean Prod. 163:69−83. DOI:10.1016/j.jclepro.2015.08.044 [11] Zhu B., Su B. and Li Y. (2018). Input-output and structural decomposition analysis of India’s carbon emissions and intensity, 2007/08–2013/14. Appl. Energ. 230:1545−1556. DOI:10.1016/j.apenergy.2018.09.026 [12] Gao P., Yue S. and Chen H. (2021). Carbon emission efficiency of China’s industry sectors: From the perspective of embodied carbon emissions. J. Clean Prod. 283:124655. DOI:10.1016/j.jclepro.2020.124655 [13] Kagawa S., Suh S., Hubacek K., et al. (2015). CO2 emission clusters within global supply chain networks: Implications for climate change mitigation. Global Environ. Chang. 35:486−496. DOI:10.1016/j.gloenvcha.2015.04.003 [14] Shi C., Chen L., Yu W., et al. (2023). Will the embedded service in supply chains play a role in lowering manufacturer’s carbon emission and maintaining economic growth. . Front Env. Sci. 10:1088162. DOI:10.3389/fenvs.2022.1088162 [15] Lenzen M., Sun Y., Faturay F., et al. (2018). The carbon footprint of global tourism. Nat. Clim. Change 8:522−528. DOI:10.1038/s41558-018-0141-x [16] Mi Z., Zheng J., Meng J., et al. (2020). Economic development and converging household carbon footprints in China. Nat. Sustain. 3:529−537. DOI:10.1038/s41893-020-0504-y [17] Wang S., Zhou S., Wu R., et al. (2024). Interregional flows of embodied carbon storage associated with land-use change in China. Ann. Am. Assoc. Geogr. 114:1526−1545. DOI: 1 0.1080/24694452.2024.2356849. [18] Wang S., Chen X., Xie R., et al. (2024). Demand-side insights for steering human appropriation of net primary productivity within planetary boundaries. One Earth 7:650−662. DOI:10.1016/j.oneear.2024.02.010 [19] Defourny J. and Thorbecke E. (1984). Structural path analysis and multiplier decomposition within a social accounting matrix framework. The Economic Journal 94:111−136. DOI:10.2307/2232220 [20] Peng J., Xie R. and Lai M. (2018). Energy-related CO2 emissions in the China’s iron and steel industry: a global supply chain analysis. Resour. Conserv. Recy. 129:392−401. DOI:10.1016/j.resconrec.2016.09.019 [21] Shi J., Li H., An H., et al. (2019). What Induces the Energy–Water Nexus in China’s Supply Chains. . Environ. Sci. Technol. 54:372−379. DOI:10.1021/acs.est.9b04277 [22] Wang Y., Deng X. and Wang R. (2024). Greenhouse gas emissions of rice supply chain in China: From production to trade. Resour. Conserv. Recy. 202:107356. DOI:10.1016/j.resconrec.2023.107356 [23] Li W., Xu D., Li G., et al. (2020). Structural path and decomposition analysis of aggregate embodied energy intensities in China, 2012-2017. J. Clean Prod. 276:124185. DOI:10.1016/j.jclepro.2020.124185 [24] Li Y., Su B. and Dasgupta S. (2018). Structural path analysis of India's carbon emissions using input-output and social accounting matrix frameworks. Energ. Econ. 76:457−469. DOI:10.1016/j.eneco.2018.10.029 [25] Chen J., Shi Q. and Zhang W. (2022). Structural path and sensitivity analysis of the CO2 emissions in the construction industry. Environ. Impact Asses. 92:106679. DOI:10.1016/j.eiar.2021.106679 [26] Tian Y., Xiong S., Ma X., et al. (2018). Structural path decomposition of carbon emission: A study of China's manufacturing industry. J. Clean Prod. 193:563−574. DOI:10.1016/j.jclepro.2018.05.047 [27] Koopman R., Wang Z. and Wei S J. (2014). Tracing value-added and double counting in gross exports. Am. Econ. Rev. 104:459−494. DOI:10.1257/aer.104.2.459 [28] Wood R. and Lenzen M. (2009). Structural path decomposition. Energ. Econ. 31:335−341. DOI:10.1016/j.jclepro.2021.129006 [29] Su B. and Ang B W. (2012). Structural decomposition analysis applied to energy and emissions: some methodological developments. Energ. Econ. 34:177−188. DOI:10.1016/j.eneco.2011.10.009 [30] Su B. and Ang B W. (2015). Multiplicative decomposition of aggregate carbon intensity change using input–output analysis. Appl. Energ. 154:13−20. DOI:10.1016/j.apenergy.2015.04.101 [31] Zhen W., Zhong Z., Wang Y., et al. (2019). Evolution of urban household indirect carbon emission responsibility from an inter-sectoral perspective: A case study of Guangdong, China. Energ. Econ. 83:197−207. DOI:10.1016/j.eneco.2019.06.022 [32] Owen A., Wood R., Barrett J., et al. (2016). Explaining value chain differences in MRIO databases through structural path decomposition. Econ. Syst. Res. 28:243−272. DOI:10.1080/09535314.2015.1135309 [33] Su B., Ang B W. and Li Y. (2019). Structural path and decomposition analysis of aggregate embodied energy and emission intensities. Energ. Econ. 83:345−360. DOI:10.1016/j.eneco.2019.07.020 [34] Li Q., Wu S., Lei Y., et al. (2021). Evolutionary path and driving forces of inter-industry transfer of CO2 emissions in China: Evidence from structural path and decomposition analysis. Sci. Total Environ. 765:142773. DOI:10.1016/j.scitotenv.2020.142773 [35] Stadler K., Wood R., Bulavskaya T., et al. (2018). EXIOBASE 3: Developing a time series of detailed environmentally extended multi‐regional input‐output tables. J. Ind. Ecol. 22:502−515. DOI:10.1111/jiec.12715 [36] Huo J., Meng J., Zhang Z., et al. (2021). Drivers of fluctuating embodied carbon emissions in international services trade. One Earth 4:1322−1332. DOI:10.1016/j.oneear.2021.08.011 [37] Sun Y., Zhang Y. and Su B. (2022). How does global transport sector improve the emissions reduction performance. A demand-side analysis. Appl. Energ. 311:118648. DOI:10.1016/j.apenergy.2022.118648 [38] Ou X., Zhang X. and Chang S. (2010). Scenario analysis on alternative fuel/vehicle for China’s future road transport: Life-cycle energy demand and GHG emissions. Energ. Policy 38:3943−3956. DOI:10.1016/j.enpol.2010.03.018 [39] Anderton R. and Tewolde T. (2011). The global financial crisis: Understanding the global trade downturn and recovery 1. The World Economy 34:741−763. DOI:10.1111/j.1467-9701.2011.01351.x [40] Neramballi A., Sakao T., Willskytt S., et al. (2020). A design navigator to guide the transition towards environmentally benign product/service systems based on LCA results. J. Clean Prod. 277:124074. DOI:10.1016/j.jclepro.2020.124074 [41] Wang F., Sun X., Reiner D M., et al. (2020). Changing trends of the elasticity of China's carbon emission intensity to industry structure and energy efficiency. Energ. Econ. 86:104679. DOI:10.1016/j.eneco.2020.104679 [42] Wang K., Tang X., Gan C., et al. (2021). Temporal-spatial evolution and influencing factors of carbon emission intensity of China's service industry. China Population Resources & Environment 31:23−31. DOI:10.1016/j.jclepro.2022.132547 [43] Liang S., Wang H., Qu S., et al. (2016). Socioeconomic drivers of greenhouse gas emissions in the United States. Environ. Sci. Technol. 50:7535−7545. DOI:10.1021/acs.est.6b00872 [44] Shafiq M N., ur Raheem F. and Ahmed A. (2020). Does Adaptation of Renewable Energy and Use of Service Industry Growth Diminution CO2 Emissions: Evidence of ASEAN Economies. iRASD Journal of Energy & Environment 1:61−71. DOI:10.52131/jee.2020.0102.0006 [45] Zhao J., Dong X. and Dong K. (2021). How does producer services’ agglomeration promote carbon reduction. : The case of China. Econ. Model 104:105624. DOI:10.1016/j.econmod.2021.105624 [46] Van Fan., Y Perry S., Klemeš J J., et al. (2018). A review on air emissions assessment: Transportation. J. Clean Prod. 194:673−684. DOI:10.1016/j.jclepro.2018.05.151 [47] Aminzadegan S., Shahriari M., Mehranfar F., et al. (2022). Factors affecting the emission of pollutants in different types of transportation: A literature review. Energy Rep. 8:2508−2529. DOI:10.1016/j.egyr.2022.01.161 [48] Shi X., Chen X., Chen Q. et al. (2025). Electric ship: A new hope for reducing carbon emissions. Innov. Geosci. 3:100116. DOI:10.59717/j.xinn-geo.2024.100116 [49] Creutzig F., Jochem P., Edelenbosch O Y., et al. (2015). Transport: A roadblock to climate change mitigation. . Science 350:911−912. DOI:10.1126/science.aac8033 [50] Wang S., Fang C., Chen X., et al. (2024). China’s ecological footprint via biomass import and consumption is increasing. Commun. Earth Environ. 5:244. DOI:10.1038/s43247-024-01399-3 [51] Liang J., Wang S., Liao Y., et al. (2024). Carbon emissions embodied in investment: Assessing emissions reduction responsibility through multi-regional input-output analysis. Appl. Energ. 358:122558. DOI:10.1016/j.apenergy.2023.122558 [52] Wang J., Shan Y., Cui C., et al. (2024). Investigating the fast energy-related carbon emissions growth in African countries and its drivers. Appl. Energ. 357:122494. DOI:10.1016/j.apenergy.2023.122494 [53] Dou X., Hong J., Ciais P., et al. (2022). Near-real-time global gridded daily CO2 emissions. The Innovation 3:100182. DOI:10.1016/j.xinn.2021.100182 -
ABOUT THIS ARTICLE
Cite this article:
Liang J., Wang S., Zhao Y., et al. (2025). Cross-border emissions in the service sector: A global analysis of environmental and economic linkages. The Innovation Geoscience 3:100133. https://doi.org/10.59717/j.xinn-geo.2025.100133
Welcome!
To request copyright permission to republish or share portions of our works, please visit Copyright Clearance Center's (CCC) Marketplace website at marketplace.copyright.com.
Export File
Citation
Liang J., Wang S., Zhao Y., et al. (2025). Cross-border emissions in the service sector: A global analysis of environmental and economic linkages. The Innovation Geoscience 3:100133. https://doi.org/10.59717/j.xinn-geo.2025.100133

Format
Content

-
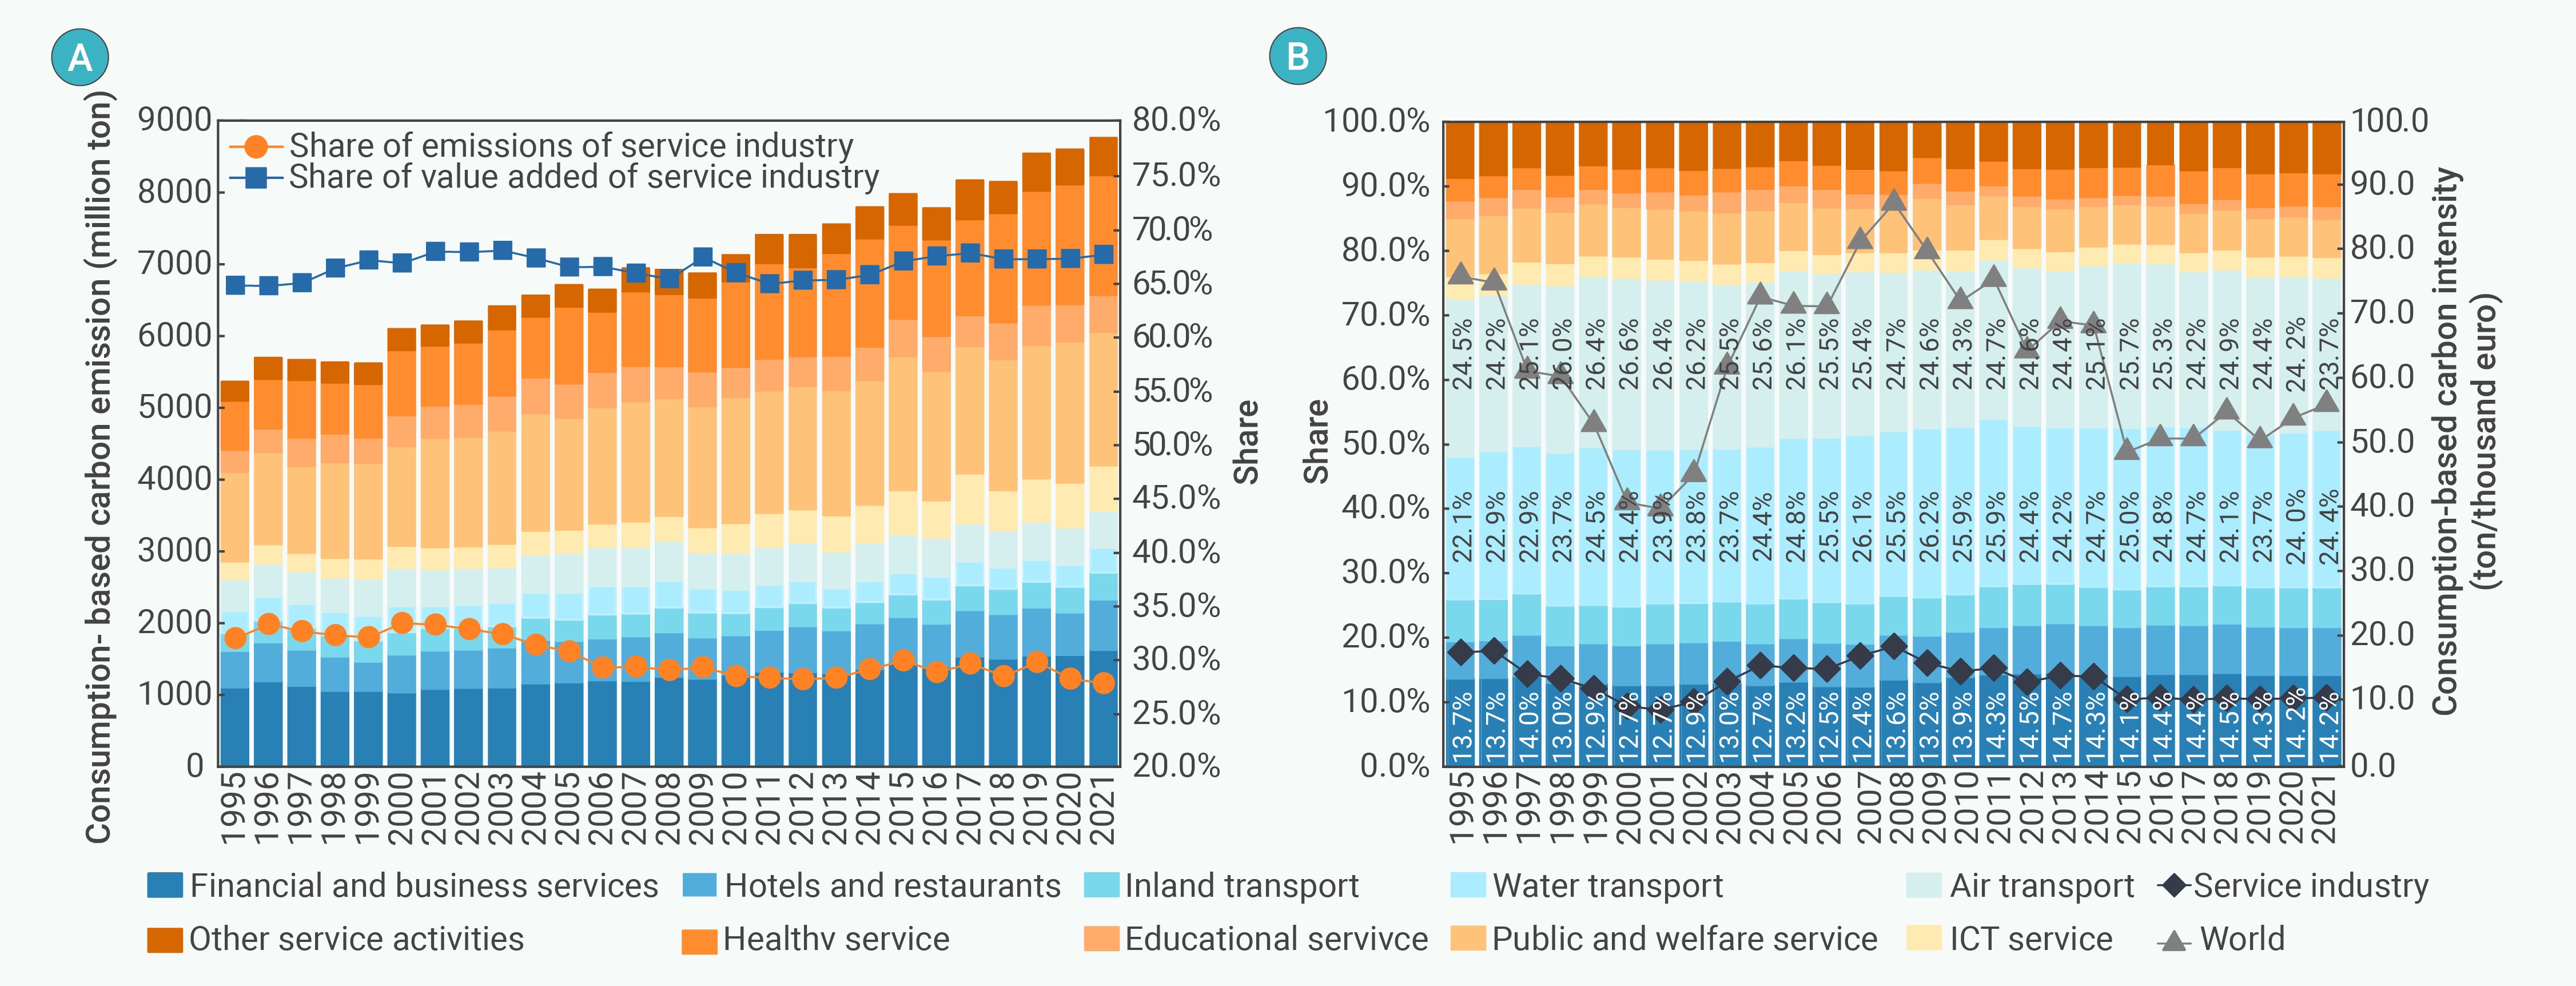
Figure 1.
The CBE, AEI and value added of the service industry, 1995-2021
-
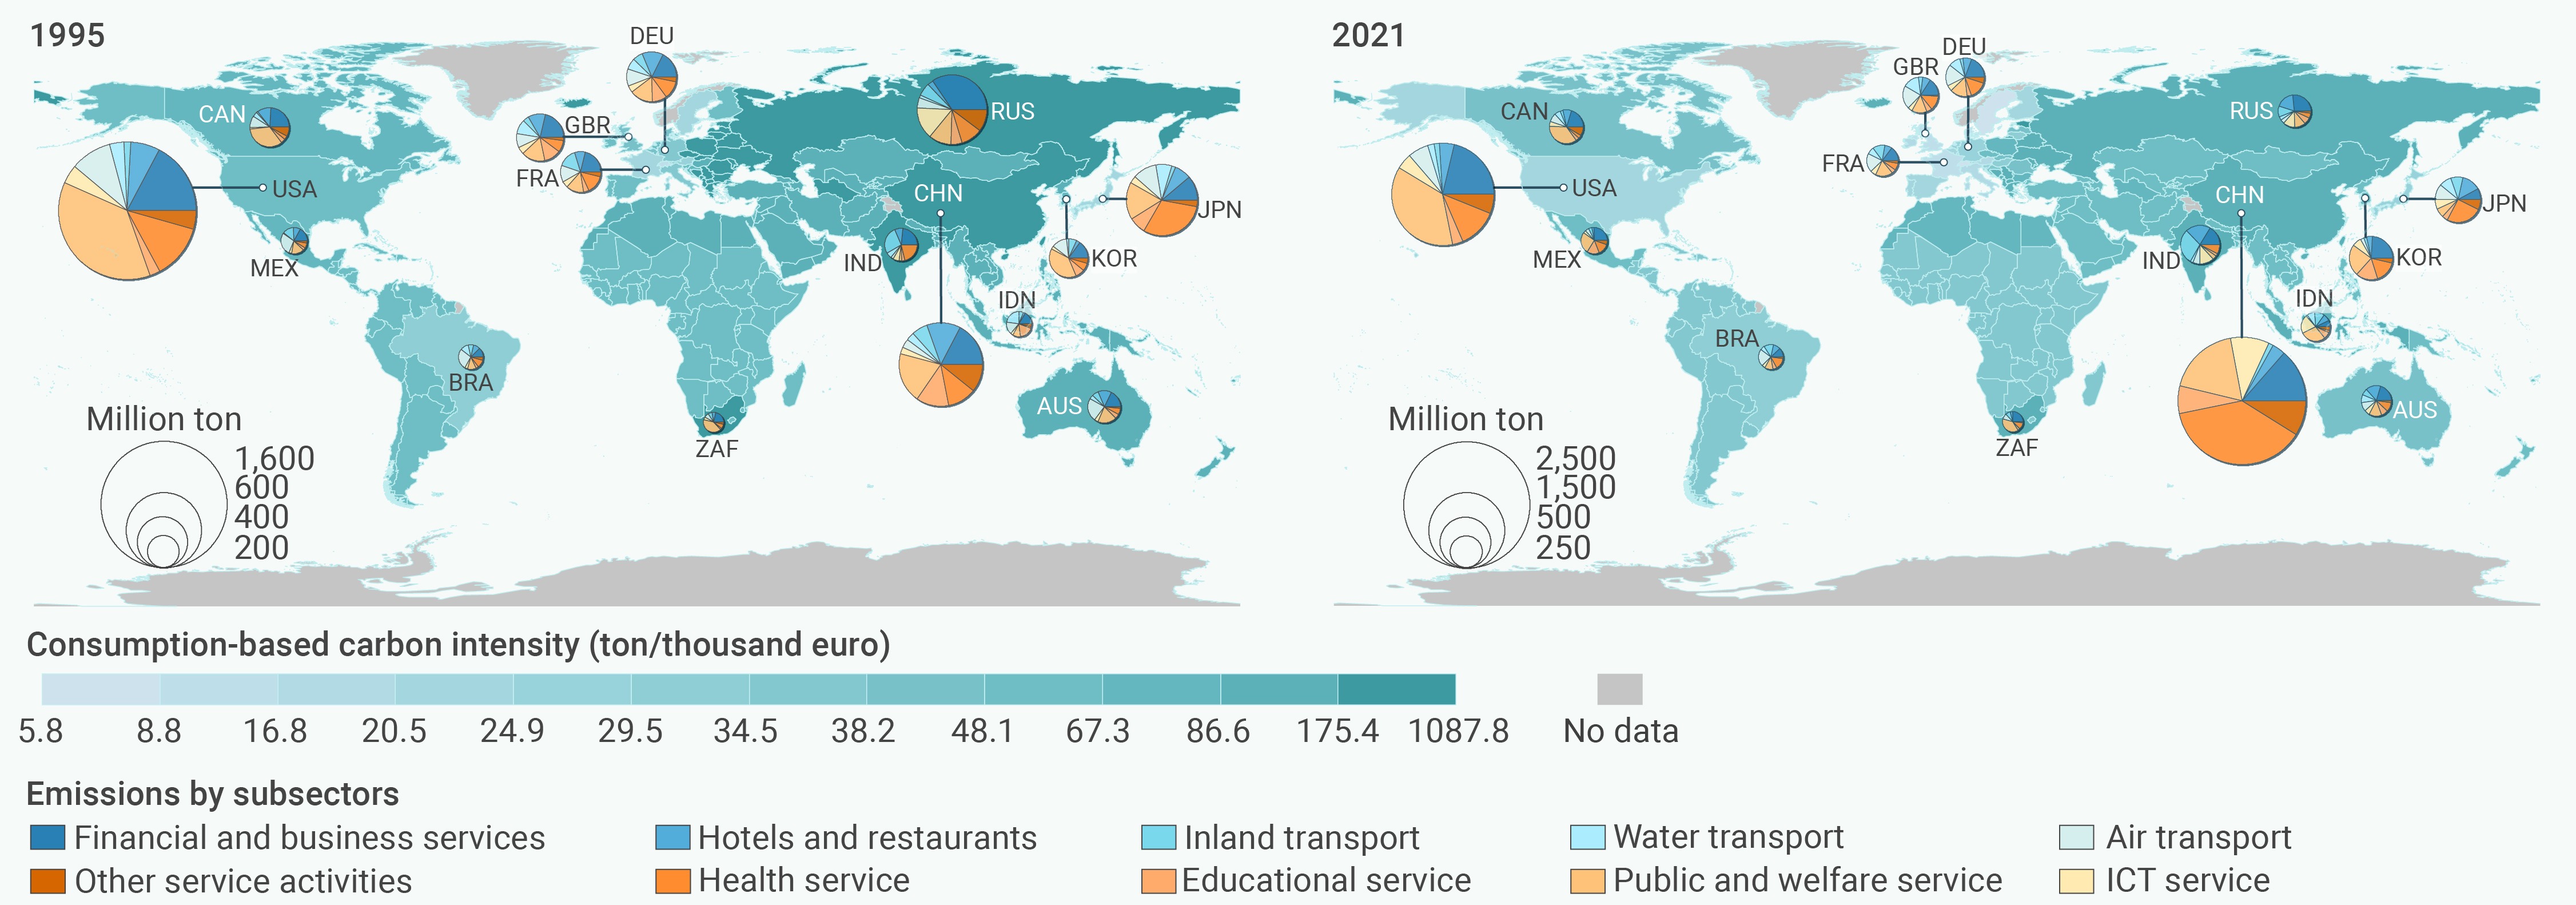
Figure 2.
The CBE and AEI of the service industry by country in 1995 and 2021
-
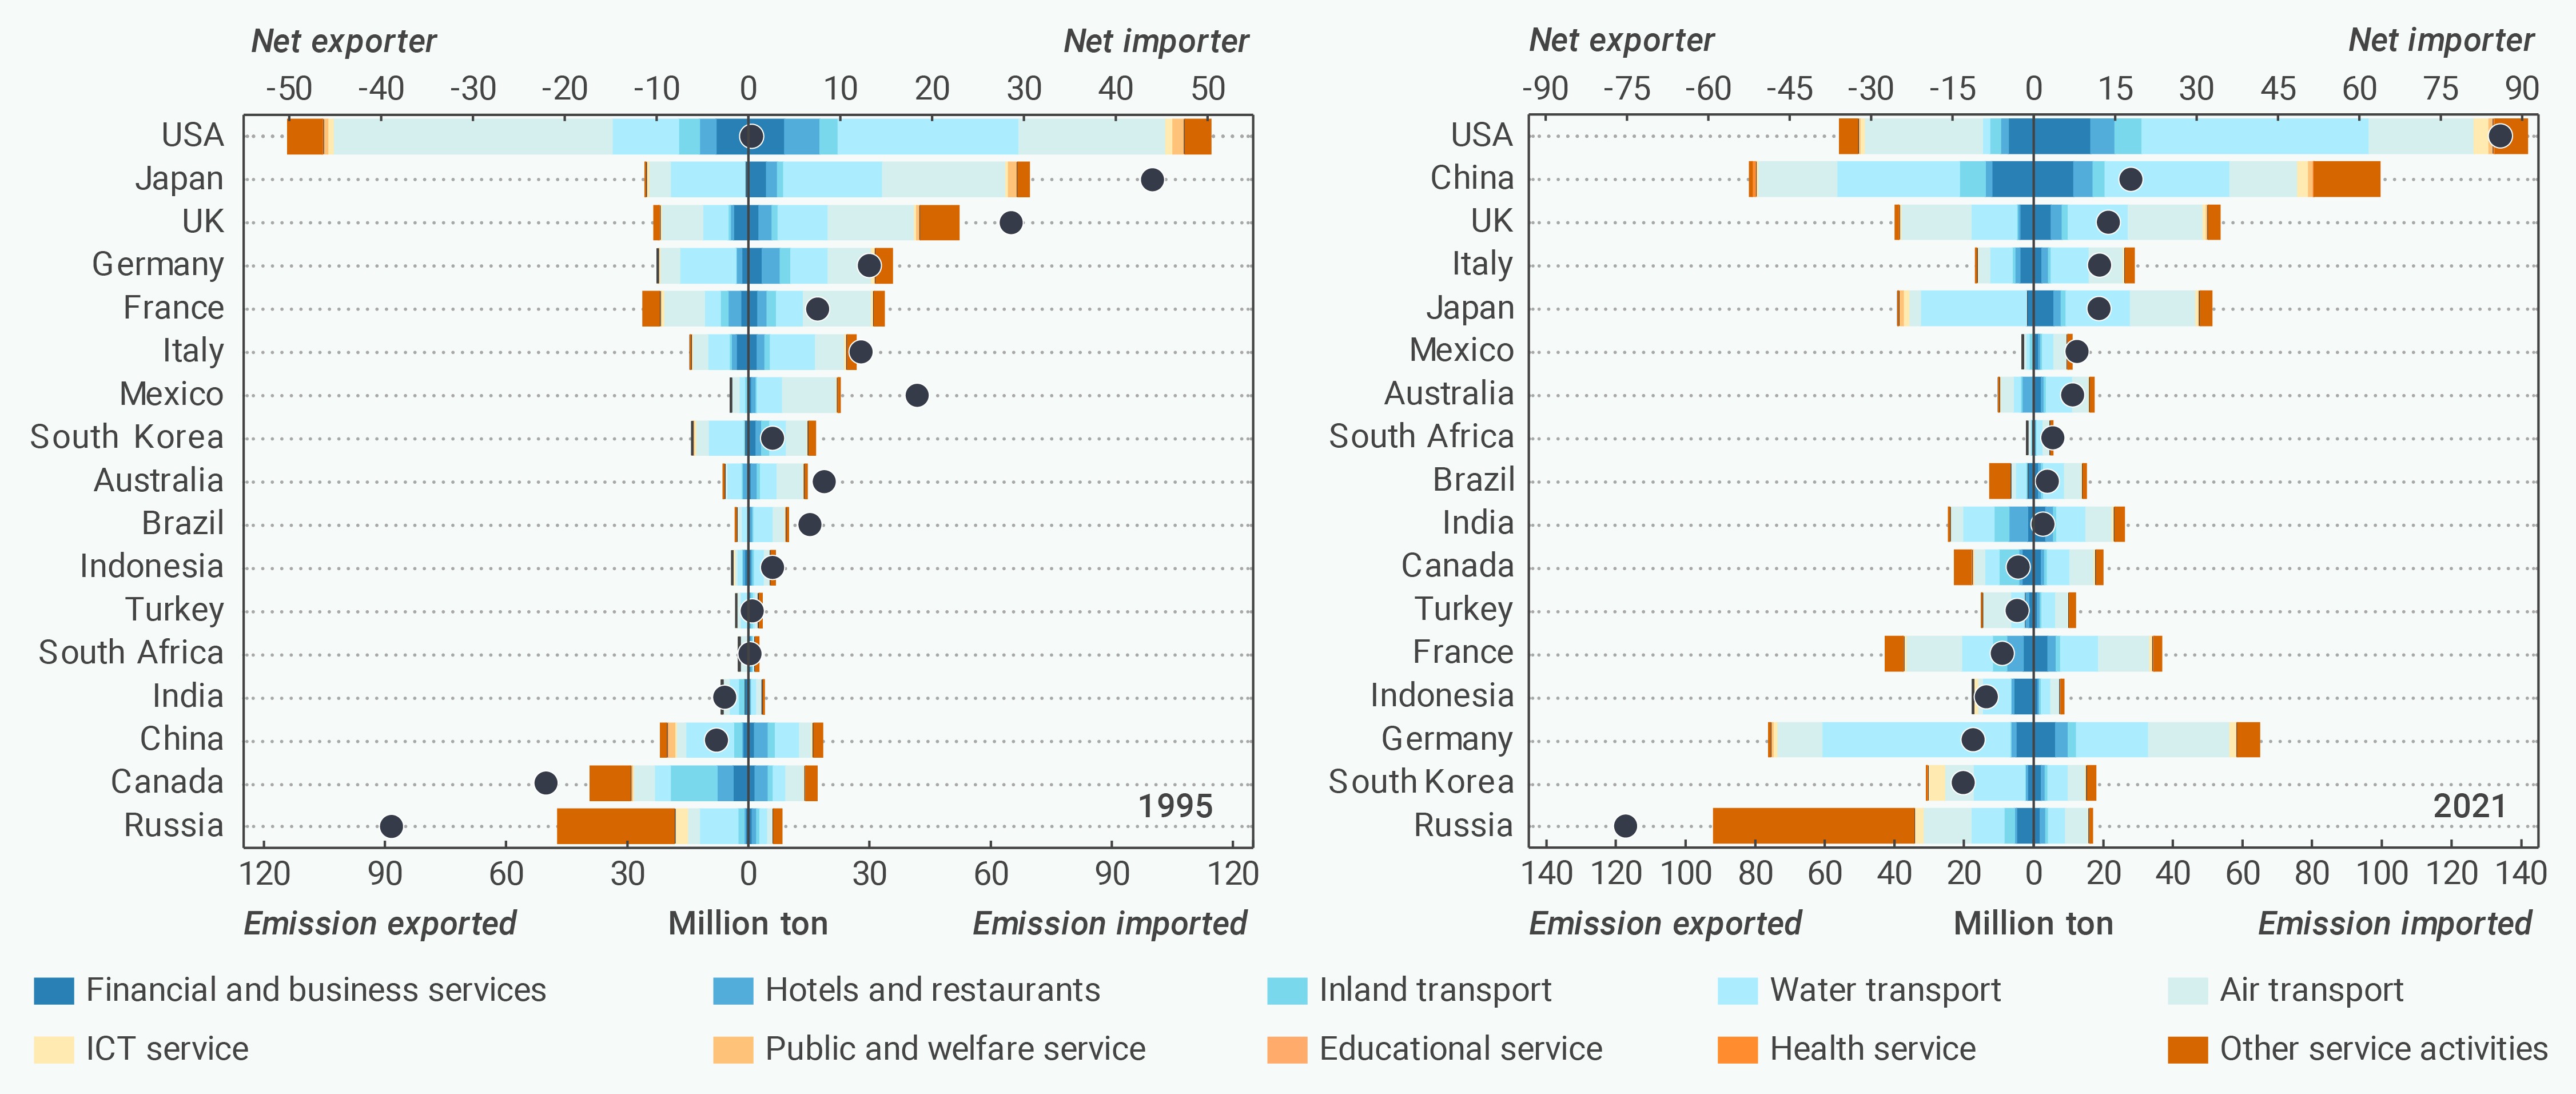
Figure 3.
The carbon emission embodied in international trade of services, by subsector, of the 17 major countries in 1995 and 2021
-
Figure 4.
Global distribution of EESI in trade
-
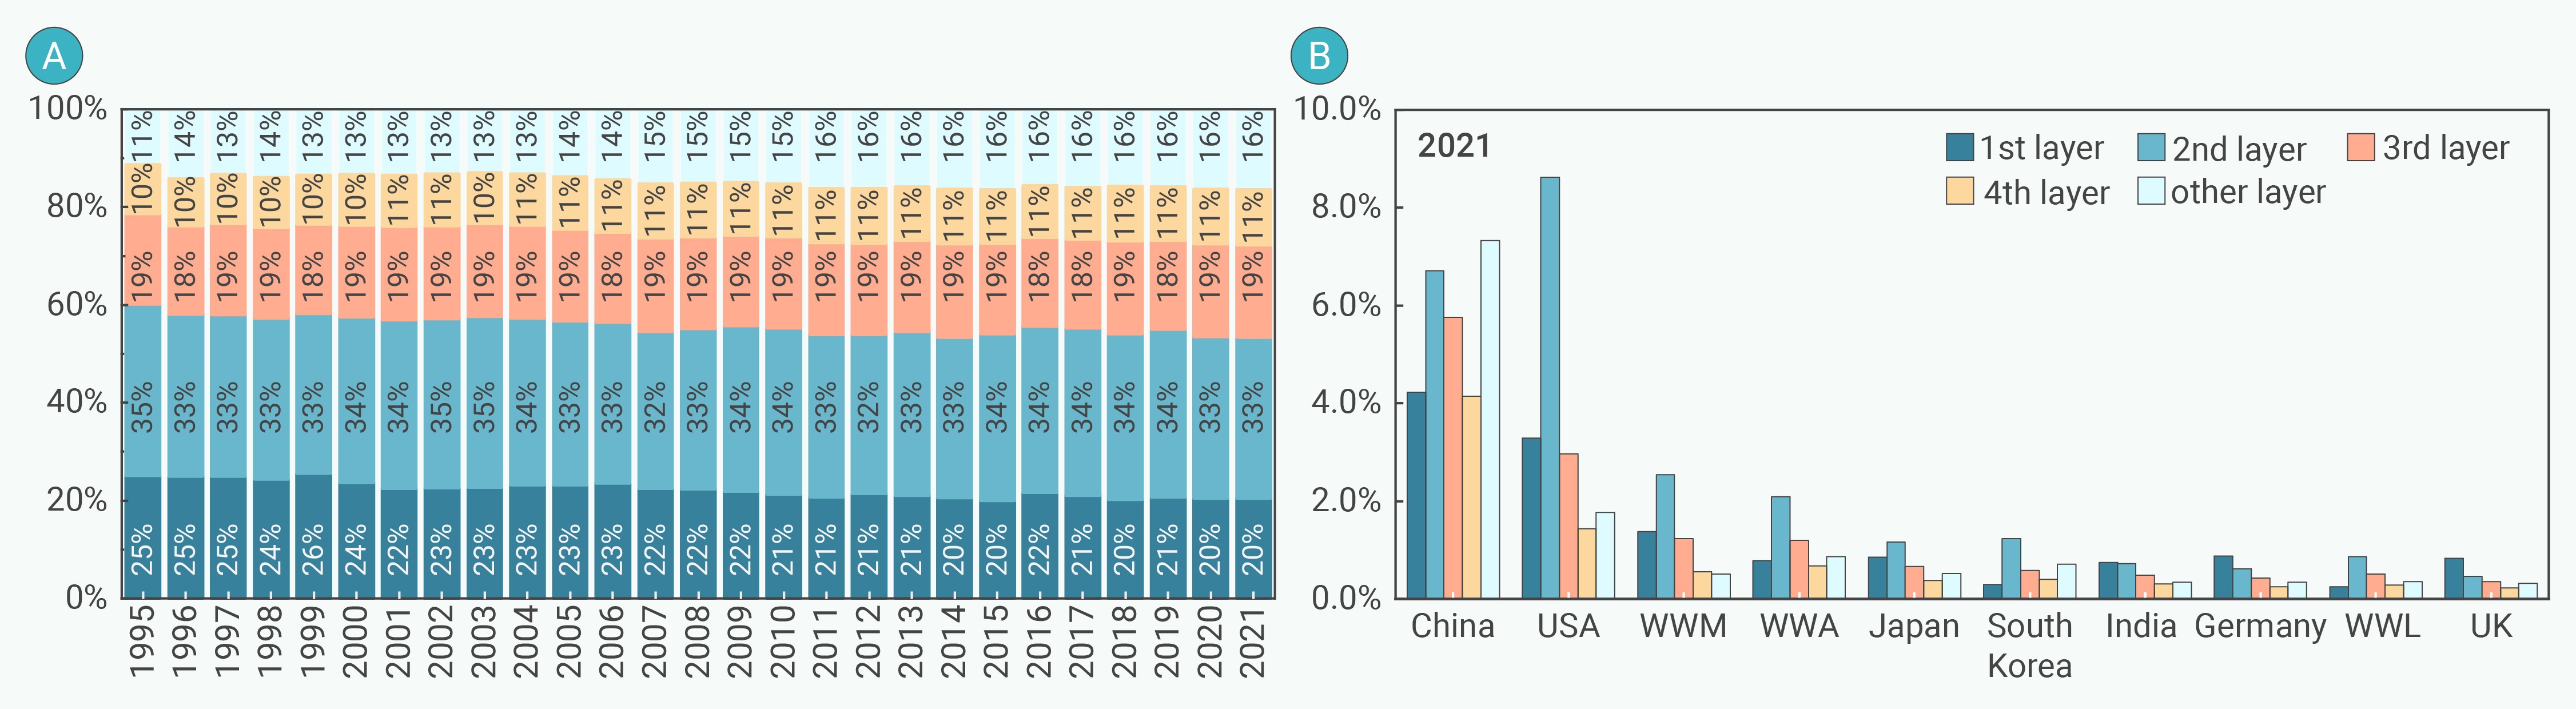
Figure 5.
Contribution of each layer to the CBE of the service industry at the global and country levels.
-
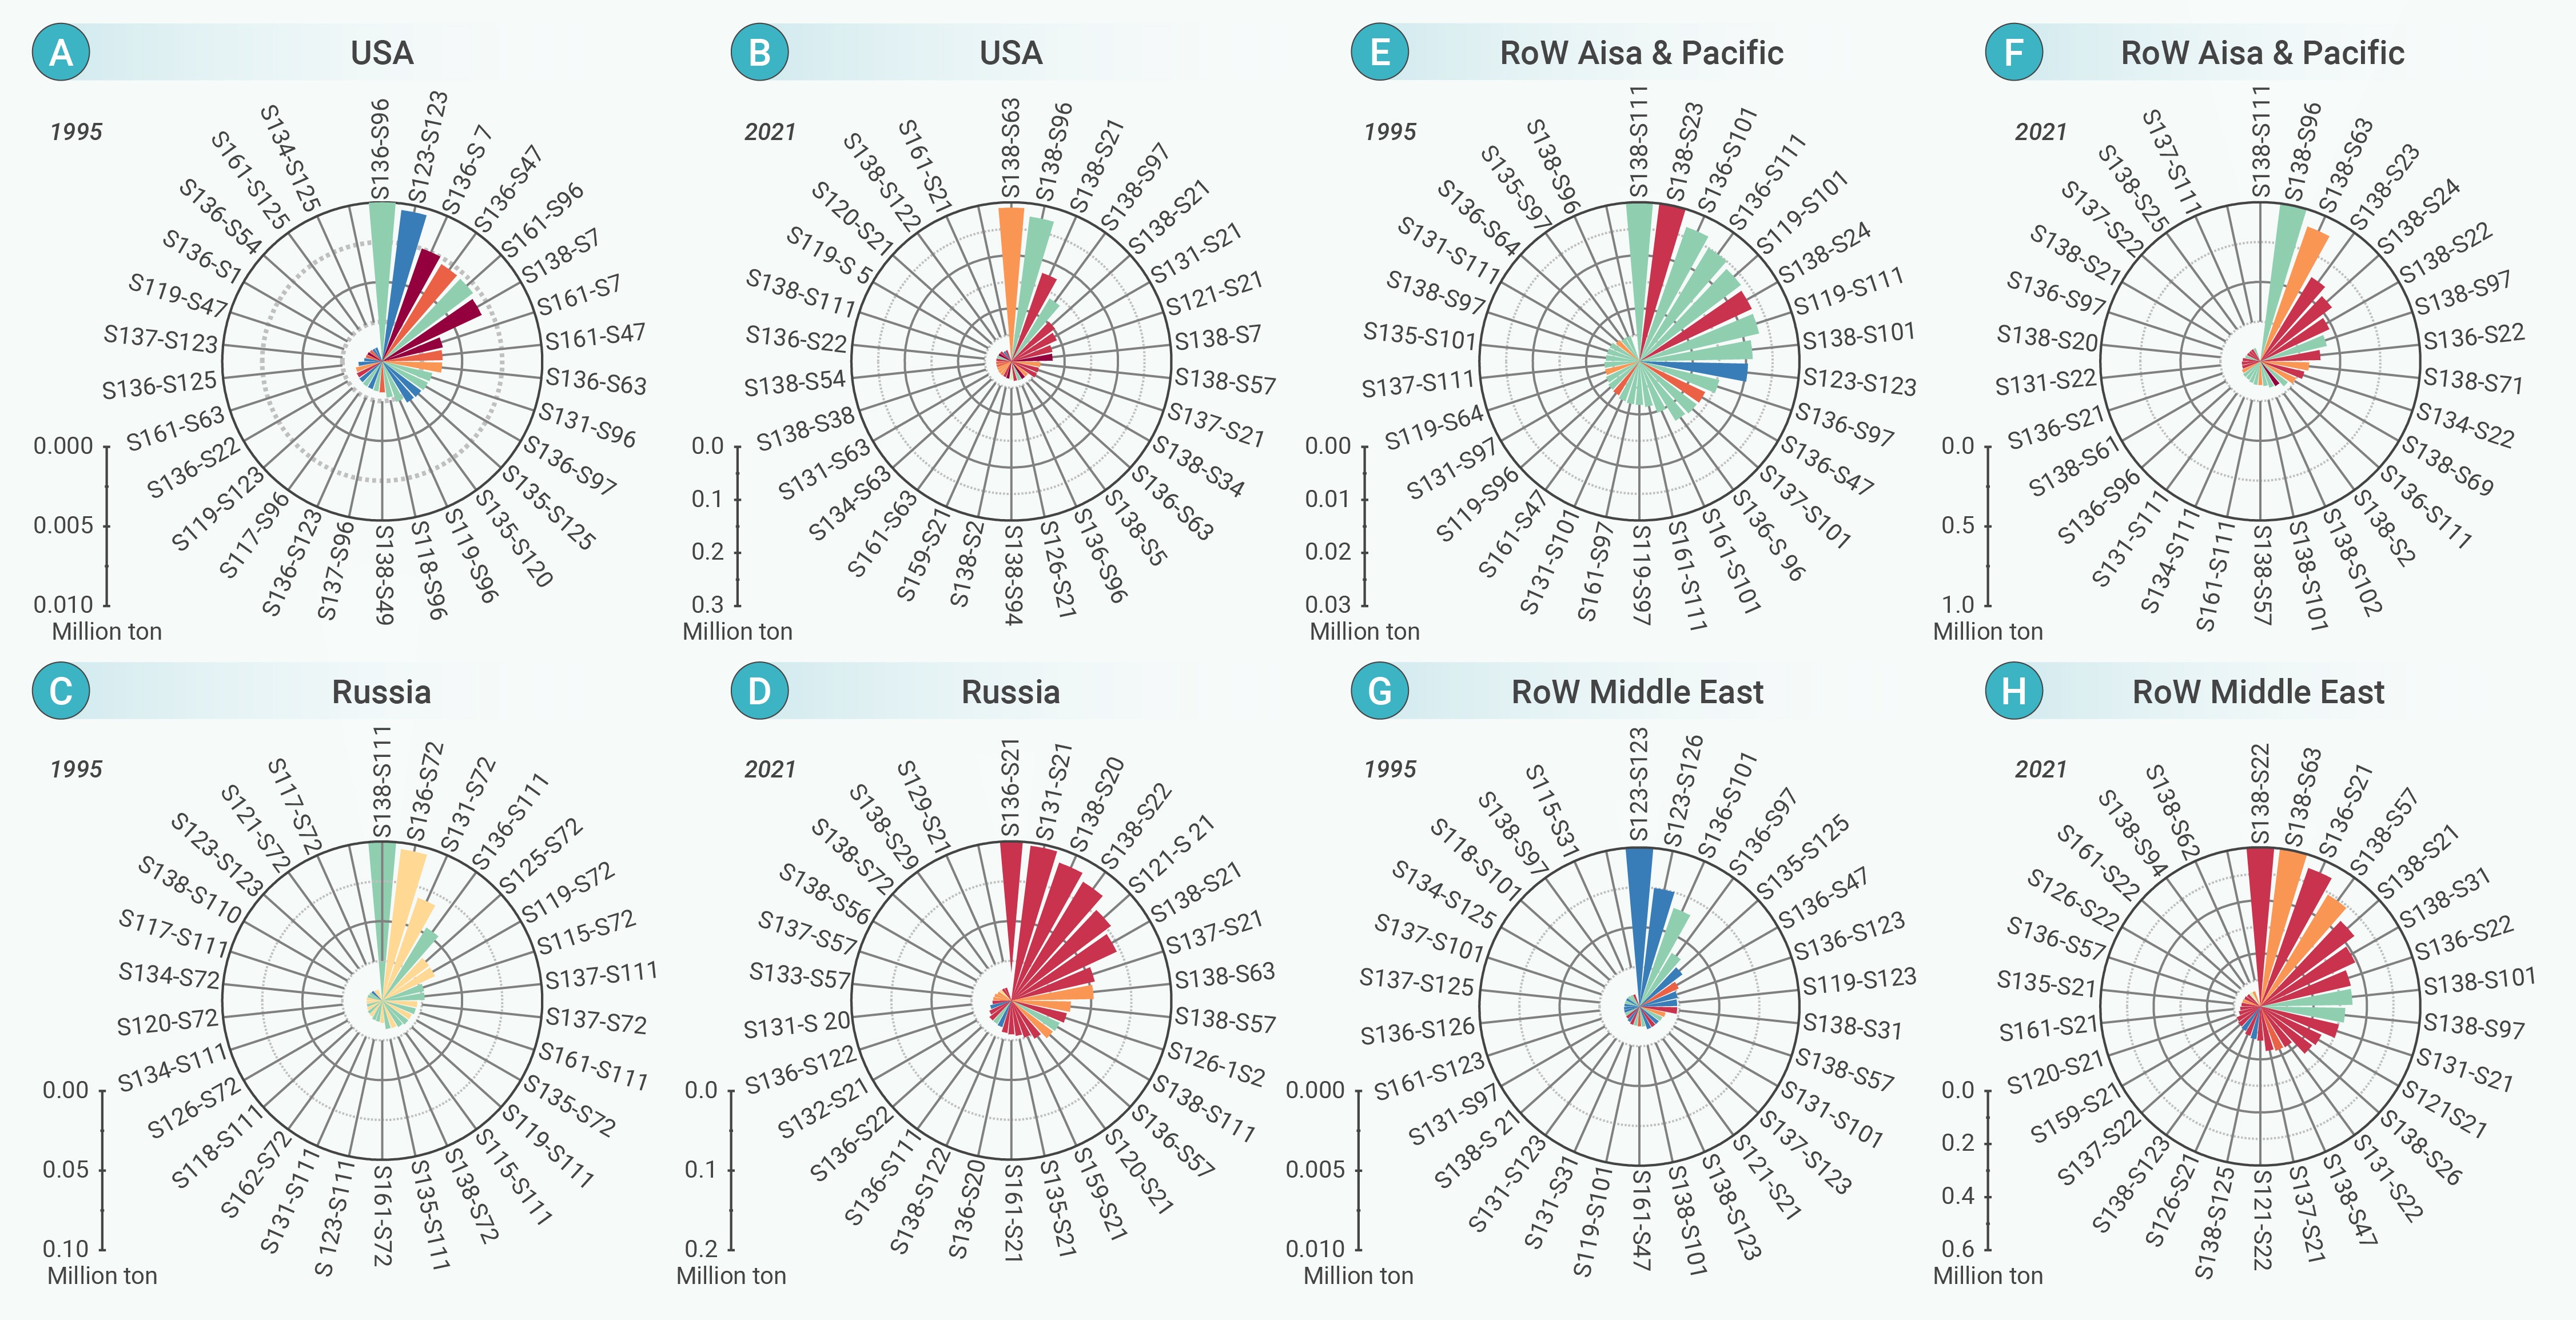
Figure 6.
The sectoral impact of Chinese service industry on the USA, Russia, RoW Asia & Pacific and RoW Middle East at the second layer in 1995 and 2021
-
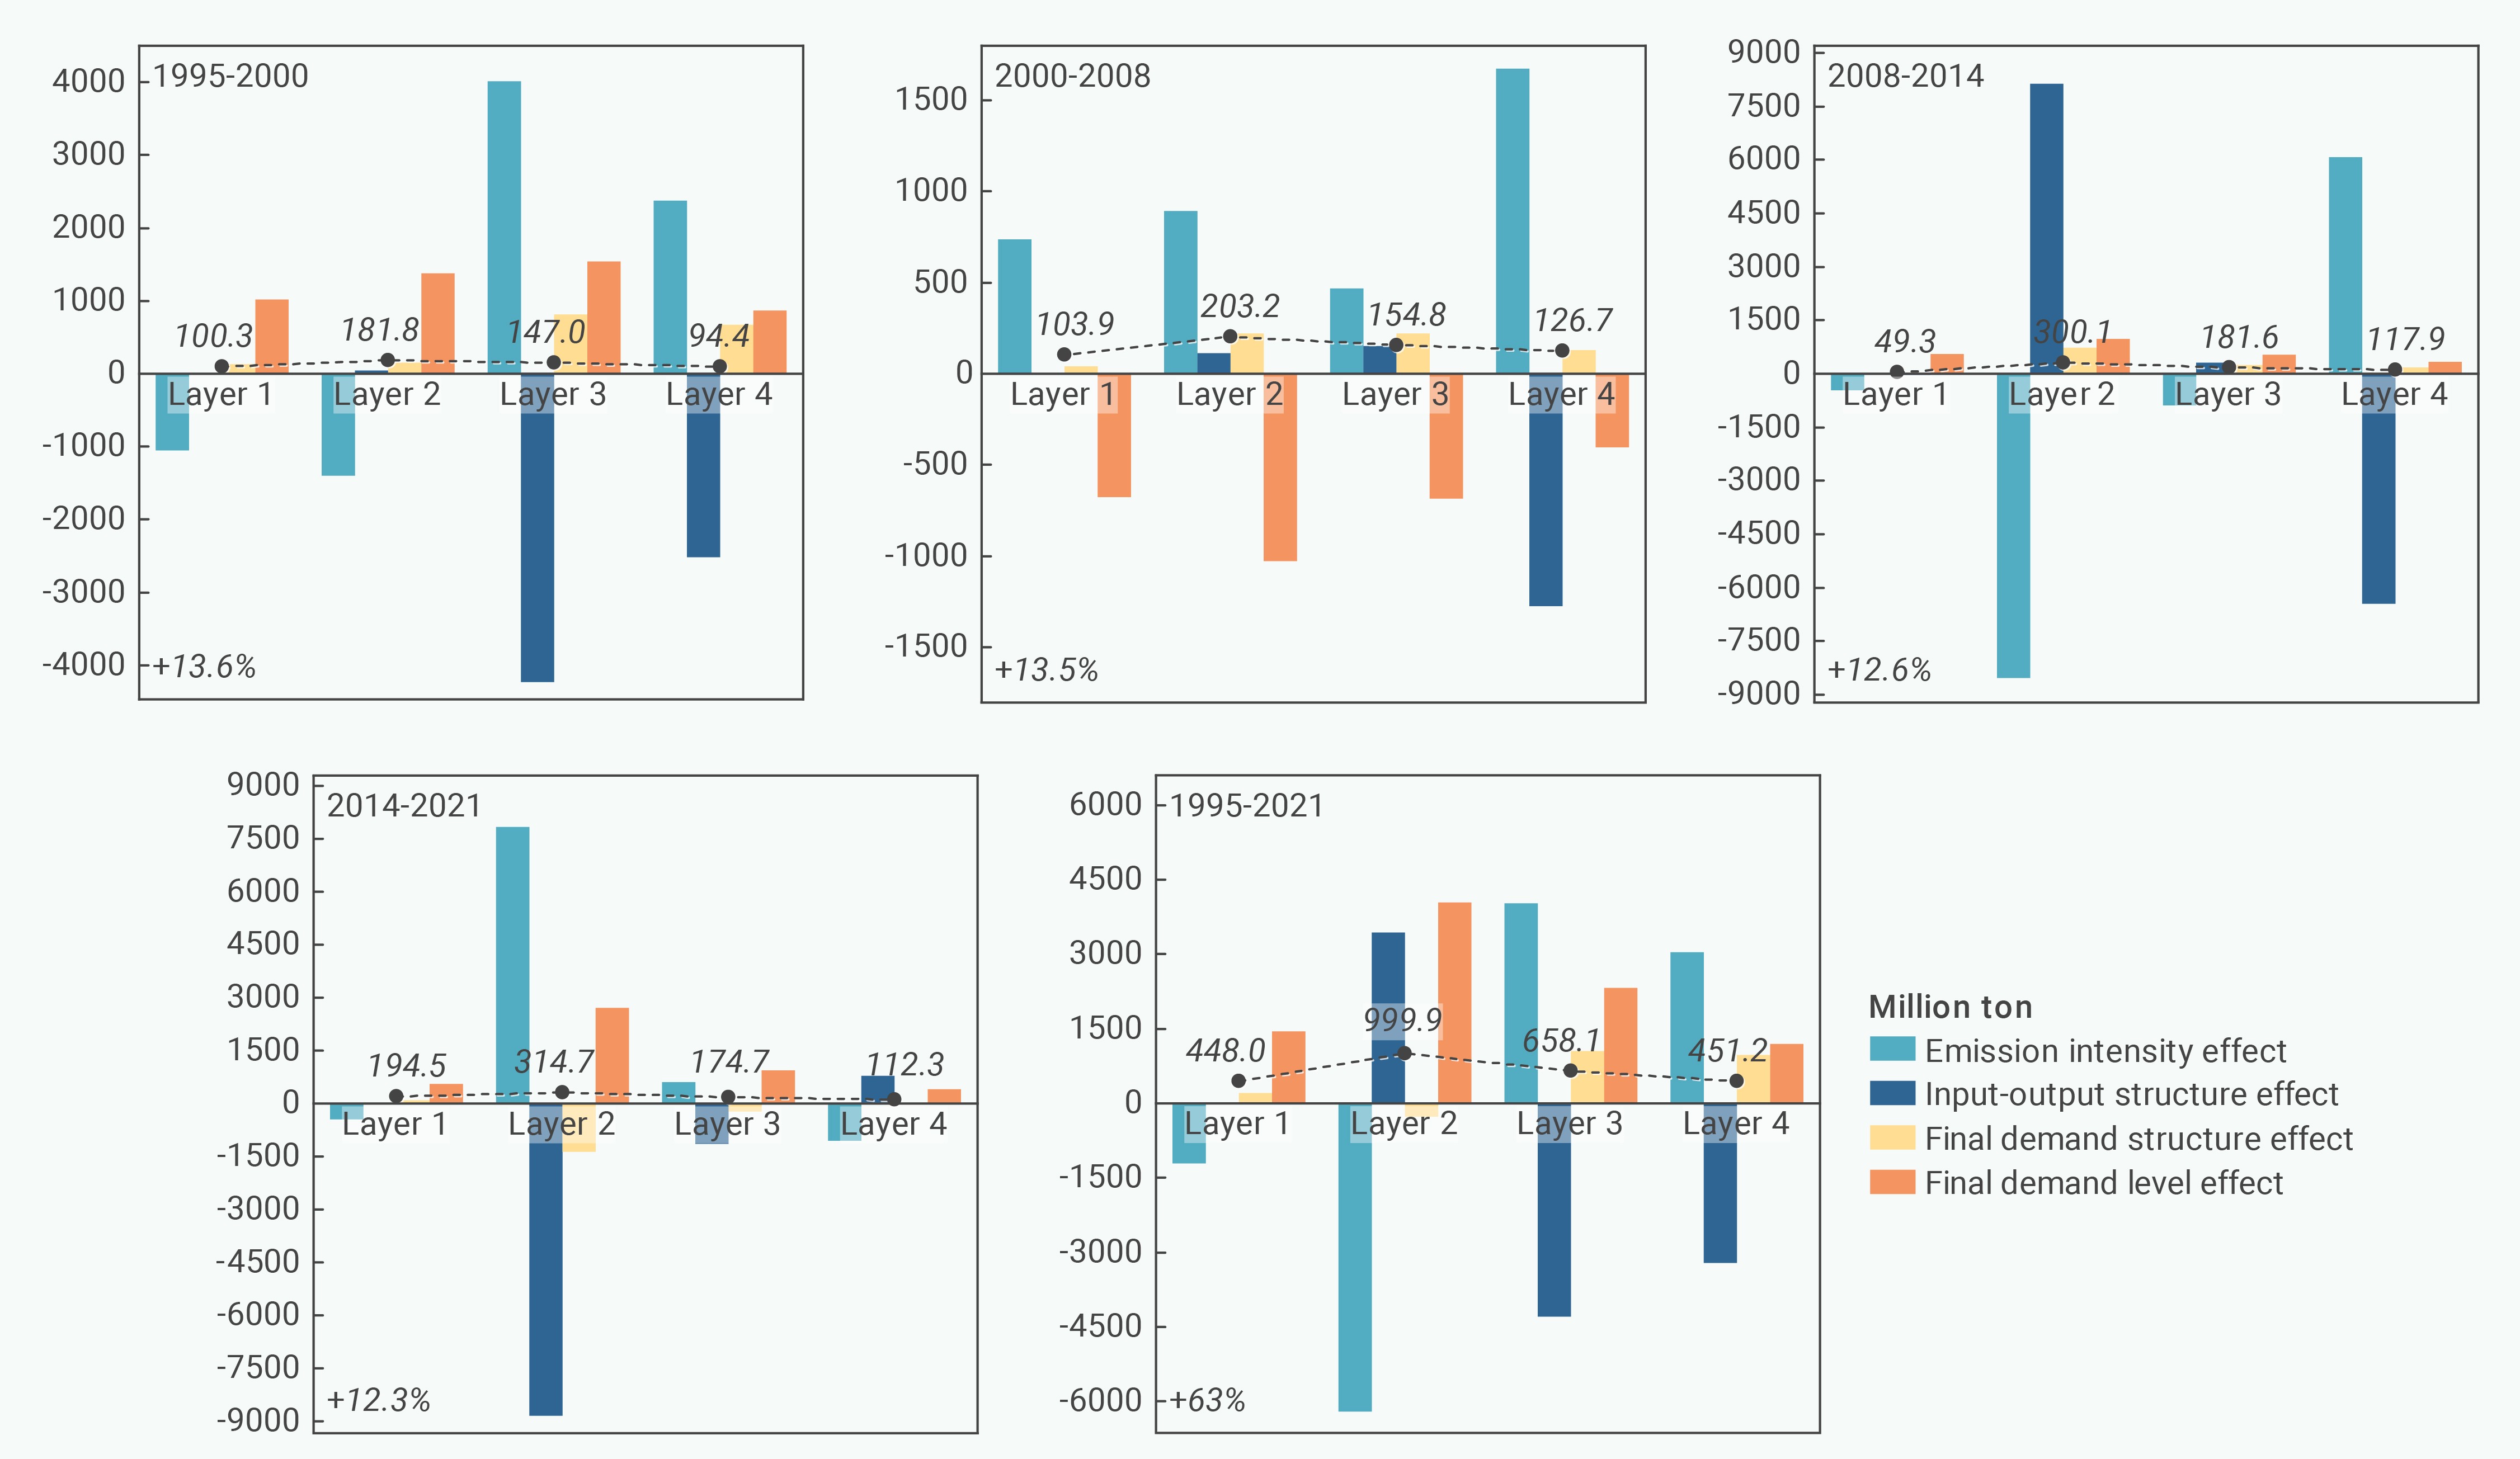
Figure 7.
Changes in the emissions of the global service industry from 1995 to 2021.
