
Effects of Street Orientation and Canyon Geometry on Thermal Improvement Efficiency of Retractable Sunshade Canopies at Pedestrian Level
-
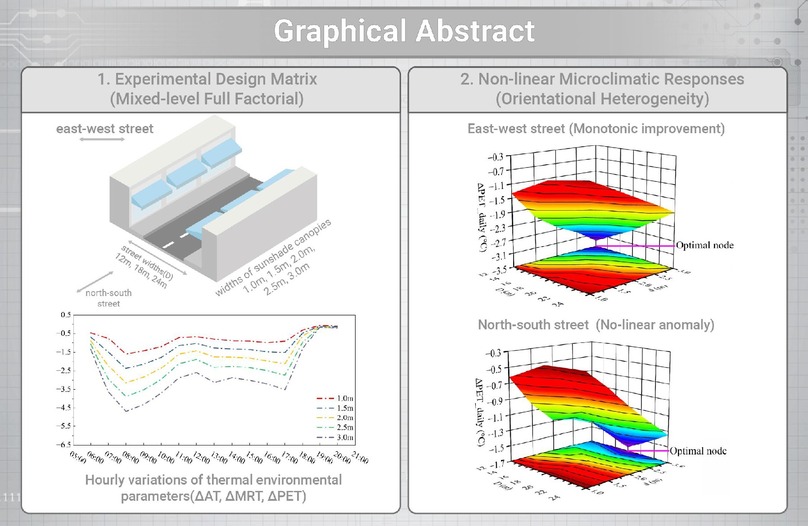
GRAPHICAL ABSTRACT
 DownLoad:
Full size image
DownLoad:
Full size image
-
PUBLIC SUMMARY
-
36 ENVI-met summer solstice scenarios simulate hourly AT, MRT & PET (6:00–20:00) for retractable building sunshades with varied street orientations, widths and canopy lengths.
Retractable canopies cut daily average PET by up to 4.67°C, mitigating extreme summer heat harm to residents and lowering buildings’ cooling energy demand.
E-W streets see linear thermal relief with longer canopies; 12m narrow streets with 3.0m canopies deliver the strongest cooling effect.
12m N-S streets with full-length canopies trap excess heat; the optimal N-S setup is 18m width + 3.0m canopies (max PET drop: -1.65°C).
Dynamic adjustable shading systems are superior to static fixed layouts for balancing pedestrian thermal comfort and building cooling loads.
-
-
ABSTRACT
The extremely hot summer in China significantly exerts adverse impacts on residents' health and intensifies building cooling energy demands. This study quantifies the thermal effects of building-mounted, retractable sunshade canopies at the pedestrian level. Hourly values (6:00–20:00) of air temperature (AT), mean radiant temperature (MRT), and physiological equivalent temperature (PET) of 36 designed scenarios on the summer solstice were simulated via the ENVI-met software. The designed experimental scenarios integrated two street orientations (east-west and north-south), three street widths (D = 12, 18, 24 m), and five sunshade canopy lengths (d = 1.0, 1.5, 2.0, 2.5, 3.0 m). The results demonstrate that sunshade canopies can effectively improve the localized thermal environment, resulting in a maximum diurnal average PET reduction of 4.67°C. In the east-west street canyons, thermal mitigation effects exhibit a monotonic linear relationship with street canopy extension, with the peak efficiency occurred in the minimum D (12 m) coupled with the maximum d (3.0 m). A distinct adverse "heat retention" anomaly occurs in narrow north-south street (12 m wide) with maximal canopy length. Consequently, for north-south streets the optimal diurnal PET strategy shifts from the narrowest configuration to a medium D (18 m) combined with the maximum d (3.0 m), delivering a maximum local thermal comfort improvement corresponding to a PET reduction of -1.65°C. These empirical findings demonstrate the need to shift from rigid, static geometric layouts to dynamic and responsive shading regulation frameworks. This approach can synergistically optimize pedestrian-level outdoor thermal environment and cooling energy use of adjacent building. -

-
REFERENCES
[1] Bongaarts J. (2024). IPCC, 2023: Climate Change 2023: Synthesis Report. Popul. Dev. Rev. 50:577−580. DOI:10.1111/padr.12632 [2] Qin P., Xie Z. and Jia B. (2026). Increasing exposure to compound heatwave and drought events in China during 1961–2020. Atmos. Res. 340:109099. DOI:10.1016/j.atmosres.2026.109099 [3] China Meteorological Administration, National Climate Committee. (2026). 2025 China Climate Bulletin. China Meteorological Administration. [4] Meehl G.A. and Tebaldi C. (2004). More intense, more frequent, and longer lasting heat waves in the 21st century. Science 305:994−997. DOI:10.1126/science.1098704 [5] Gao J., Sun P., Huang M., et al. (2026). The interplay of heatwaves, air pollution, and green space on all-cause mortality in older adults with diabetes mellitus: a national cohort study. BMC Public Health 26:27606. DOI:10.1186/s12889-026-27606-8 [6] Wu R., Zhang J., Luo Z., et al. (2026). Spatiotemporal evolution of heat health risks in megacities at the township and subdistrict scales: A case study of Chongqing's central urban area. Urban Clim. 67:102920. DOI:10.1016/j.uclim.2026.102920 [7] Htay W.Z., Ng S.F.C., Kim Y., et al. (2026). Heatwaves, Cold Spells, and Renal Disease Mortality in Japan: Vulnerable Populations and Temporal Trends. Environ. Health 4:919−928. DOI:10.1021/envhealth.5c00468 [8] Pinto A., Pennisi F., Borlini S., et al. (2026). Effects of Heat Waves on Hospitalizations, Emergency Department Visits, and Outpatient Care in Frail Older Adults: A Systematic Review and Meta-Analysis. Diseases 14:176. DOI:10.3390/diseases14050176 [9] Zhang J., Zhu G., Yin J., et al. (2024). Analysis of summer high temperature observations based on different sub surfaces. Earth Sci. Inform. DOI:10.1007/s12145-024-01439-8 [10] Unal M. and Middel A. (2025). Improving thermal comfort in hot-arid Phoenix, Arizona courtyards: Exploring the cooling benefits of ground surface cover and shade. Build. Environ. 278:113001. DOI:10.1016/j.buildenv.2025.113001 [11] Bao J., Xu L., Shi Y., et al. (2023). The Influence of Street Morphology on Thermal Environment Based on ENVI-met Simulation. ISPRS Int. J. Geo-Inf. 12:303. DOI:10.3390/ijgi12080303 [12] Jayasinghe S., Jayasooriya V., Dassanayake M.S., et al. (2024). Effects of street tree configuration and placement on streetside thermal environment within a tropical urban canyon. Int. J. Biometeorol. 68:1133−1142. DOI:10.1007/s00484-024-02653-1 [13] Zou M. and Zhang H. (2021). Cooling strategies for thermal comfort in cities: a review of key methods in landscape design. Environ. Sci. Pollut. Res. 28:62640−62650. DOI:10.1007/s11356-021-15172-y [14] Hoppe P. (1999). The physiological equivalent temperature - a universal index for the biometeorological assessment of the thermal environment. Int. J. Biometeorol. 43:71−75. DOI:10.1007/s004840050118 [15] Sargazi A.M., Heidari A., Davtalab J., et al. (2025). Comparative reliability assessment of PET and UTCI thermal comfort indices using Monte Carlo simulation. Sci. Rep. 16:3431. DOI:10.1038/s41598-025-33440-6 [16] Zhang M., Yan H., Wu R., et al. (2026). Quantifying pedestrian thermal comfort under extreme heat using 360° street view factors. Sustain. Cities Soc. 146:107515. DOI:10.1016/j.scs.2026.107515 [17] Aydin E.E., Chen Z., Ortner P.F., et al. (2026). Universal Thermal Climate Index (UTCI)-adjusted pedestrian accessibility: Urban design exploration for climate-resilience in tropical climates. Sustain. Cities Soc. 143:107335. DOI:10.1016/j.scs.2026.107335 [18] Borsi S.H., Khodadadi N., Khanjani N., Dastoorpoor M. (2021). Physiological equivalent temperature (PET) index and respiratory hospital admissions in Ahvaz, southwest of Iran. Environ. Sci. Pollut. Res. 28:51888−51896. DOI:10.1007/s11356-021-14345-z [19] Ma X., Zhang L., Guo M., Zhao J. (2021). The effect of various urban design parameter in alleviating urban heat island and improving thermal health. Environ. Sci. Pollut. Res. 28:38406−38425. DOI:10.1007/s11356-021-13179-z [20] Sharafkhani R., Khanjani N., Bakhtiari B., et al. (2020). The effect of physiological equivalent temperature index variations on mortality in Urmia (The Northwest of Iran). Urban Clim. 32:100595. DOI:10.1016/j.uclim.2020.100595 [21] Cui D.J., Zhang Y., Li X.Y., et al. (2022). Effects of different vertical façade greenery systems on pedestrian thermal comfort in deep street canyons. Urban For. Urban Green. 72:127582. DOI:10.1016/j.ufug.2022.127582 [22] Zhao H., Duan H., Wang Y., et al. (2026). A systematic review of outdoor thermal comfort research: Integrating climate zones, population groups, and methodological frameworks. Sustain. Cities Soc. 143:107339. DOI:10.1016/j.scs.2026.107339 [23] Roshan G., Yousefi R., Kovacs A., et al. (2018). A comprehensive analysis of physiologically equivalent temperature changes of Iranian selected stations for the last half century. Theor. Appl. Climatol. 131:19−41. DOI:10.1007/s00704-016-1950-3 [24] Shen P., Wang M., Ma H., et al. (2024). On the two-way interactions of urban thermal environment and air pollution: A review of synergies for identifying climate-resilient mitigation strategies. Build. Simul. 18:1−21. DOI:10.1007/s12273-024-1210-X [25] Lee J., Kim M., Chon J. (2026). Street greenery design strategies to mitigate urban heat islands using the 2D and 3D streetscape indices. Trees For. People 23:101111. DOI:10.1016/j.tfp.2025.101111 [26] Priyadarshni P. and Pandey P. (2026). A footprint of UHI in India: a systematic review of causative factors, impacts and mitigation strategies. Front. Sustain. Cities 7:1649138. DOI:10.3389/frsc.2025.1649138 [27] Tsirigoti D. and Gkyrtis K. (2026). Recycled Pavement Materials and Urban Microclimate: Albedo and Thermal Capacity Effects on Heat Island. Solar 6:5. DOI:10.3390/sol6010005 [28] Mohsen A., Hassan S.T. and Mansoureh T. (2026). Evaluating the Efficiency of Materials and Vegetation in Enhancing Outdoor Thermal Comfort in Hot and Arid Climates. J. Urban Plann. Dev. 152(3). DOI:10.1061/jupddm.upeng-5781. [29] Jonathan R., Lin T., Lun I., et al. (2026). The impact of building façade materials toward outdoor thermal comfort and urban heat island. IOP Conference Series: Earth Environ. Sci. 158:012011. DOI:10.1088/1755-1315/1582/1/012011 [30] Zheng Z., Lin X., Chen L., et al. (2024). Effects of urbanization and topography on thermal comfort during a heat wave event. Sustain. Cities Soc. 102:105233. DOI:10.1016/j.scs.2024.105233 [31] Perini K., Chokhachian A., Dong S., Auer T. (2017). Modeling and simulating urban outdoor comfort: Coupling ENVI-Met and TRNSYS. Energy Build. 152:373−384. DOI:10.1016/j.enbuild.2017.07.061 [32] Tsoka S., Tsikaloudaki A., Theodosiou T. (2018). Analyzing the ENVI-met microclimate model's performance and assessing cool materials and urban vegetation applications-A review. Sustain. Cities Soc. 43:55−76. DOI:10.1016/j.scs.2018.08.009 [33] Yang Y.J., Zhou D., Wang Y.P., et al. (2019). Economical and outdoor thermal comfort analysis of greening in multistory residential areas. Sustain. Cities Soc. 51:101730. DOI:10.1016/j.scs.2019.101730 [34] Zhu Z.Z., Zhou D., Wang Y.P., et al. (2021). Assessment of urban surface and canopy cooling strategies in high-rise residential communities. J. Clean. Prod. 288:125599. DOI:10.1016/j.jclepro.2020.125599 -
ABOUT THIS ARTICLE
Cite this article:
Zhu Z., Wang D., Ma C., et al. (2026). Effects of Street Orientation and Canyon Geometry on Thermal Improvement Efficiency of Retractable Sunshade Canopies at Pedestrian Level. Energy Use 2:100058. https://doi.org/10.59717/ipj.energy-use.2026.100058
Welcome!
To request copyright permission to republish or share portions of our works, please visit Copyright Clearance Center's (CCC) Marketplace website at marketplace.copyright.com.
Export File
Citation
Zhu Z., Wang D., Ma C., et al. (2026). Effects of Street Orientation and Canyon Geometry on Thermal Improvement Efficiency of Retractable Sunshade Canopies at Pedestrian Level. Energy Use 2:100058. https://doi.org/10.59717/ipj.energy-use.2026.100058

Format
Content
-
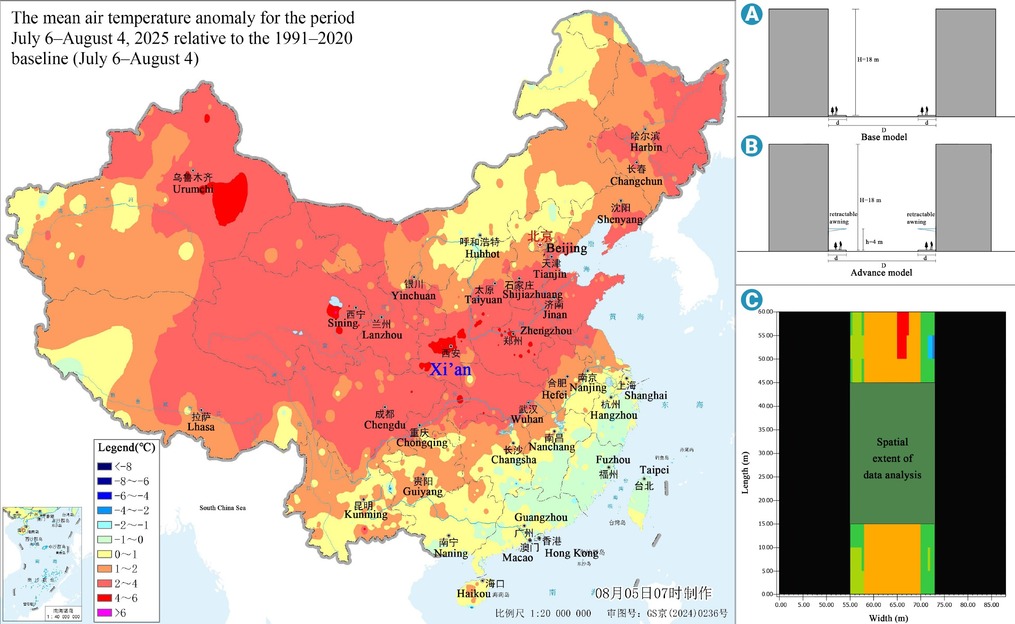
Figure 1.
Location of Xi’an and the mean air temperature anomaly for the period July 6-August 4, 2025, relative to the 1991-2020 WMO baseline (July 6-August 4) (data source:National Climate Centre, https://cmdp.ncc-cma.net/cn/index.htm)
-
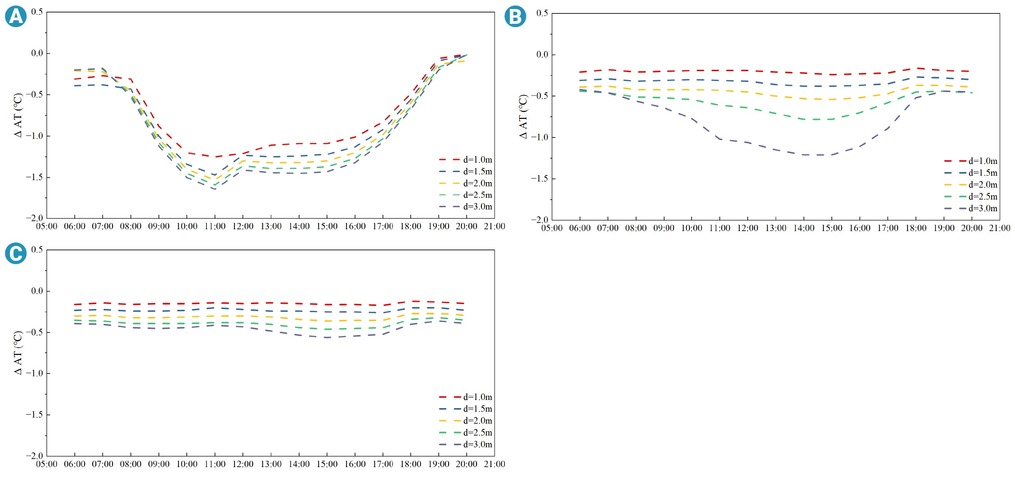
Figure 2.
East-west air temperature variation:(A) D=12m, (B) D=18m, (C) D=24m.
-
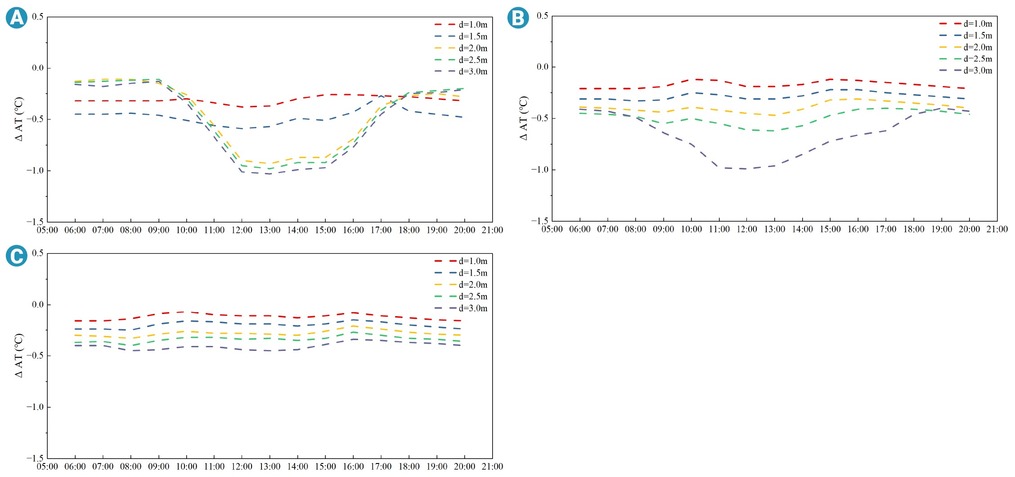
Figure 3.
North-south air temperature variation:(A) D=12m, (B) D=18m, (C) D=24m.
-
Figure 4.
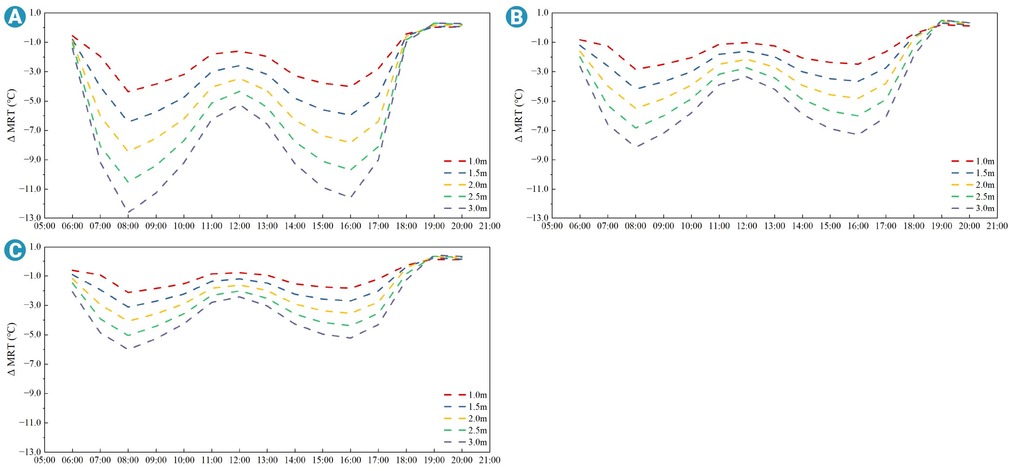
East-west MRT variation:(A) D=12m, (B) D=18m, (C) D=24m.
-
Figure 5.
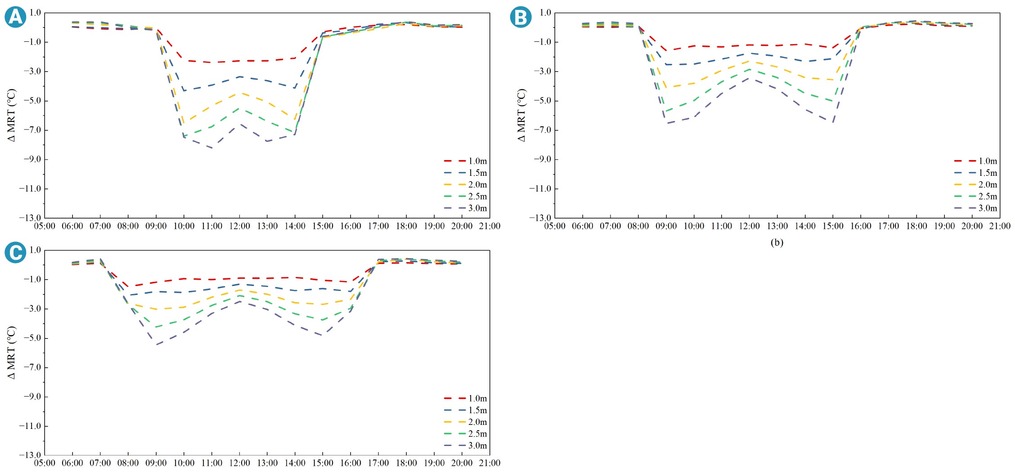
North-south MRT variation:(A) D=12m, (B) D=18m, (C) D=24m.
-
Figure 6.
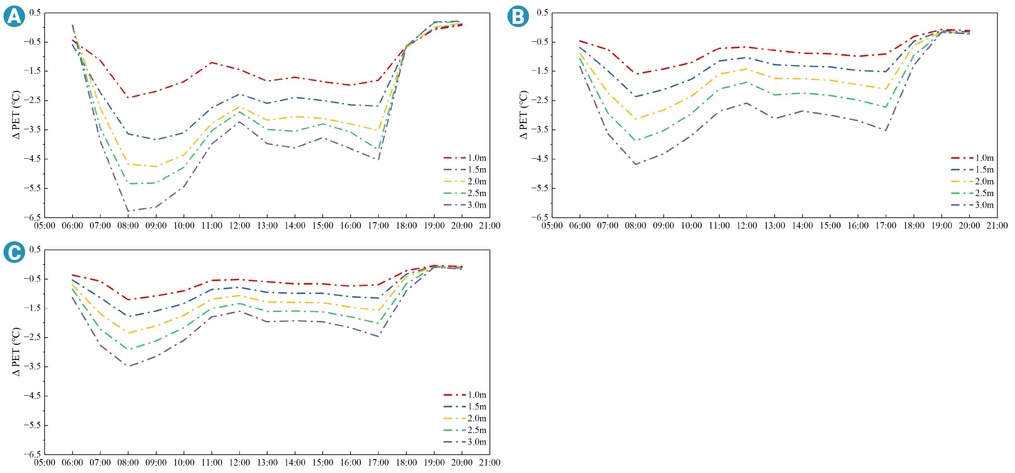
East-west MRT variation:(A) D=12m, (B) D=18m, (C) D=24m.
-
Figure 7.
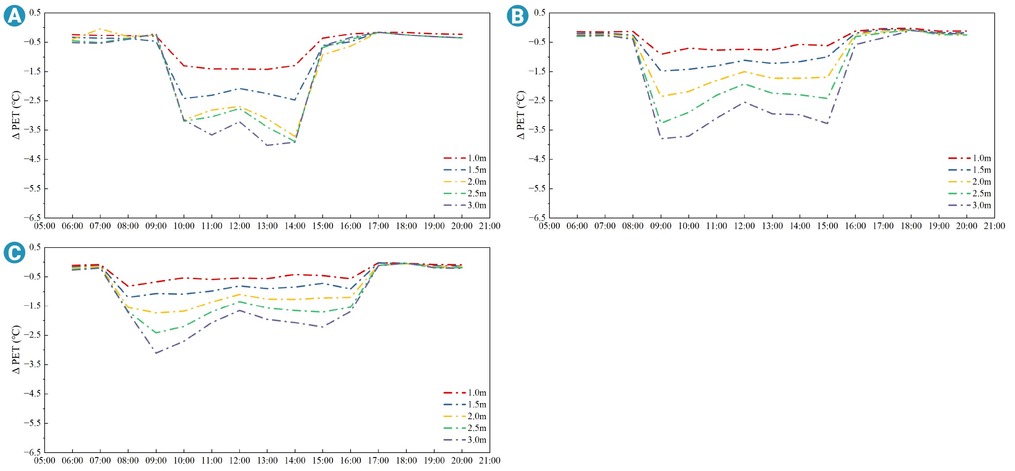
North-south PET variation:(A) D=12m, (B) D=18m, (C) D=24m.
-
Figure 8.
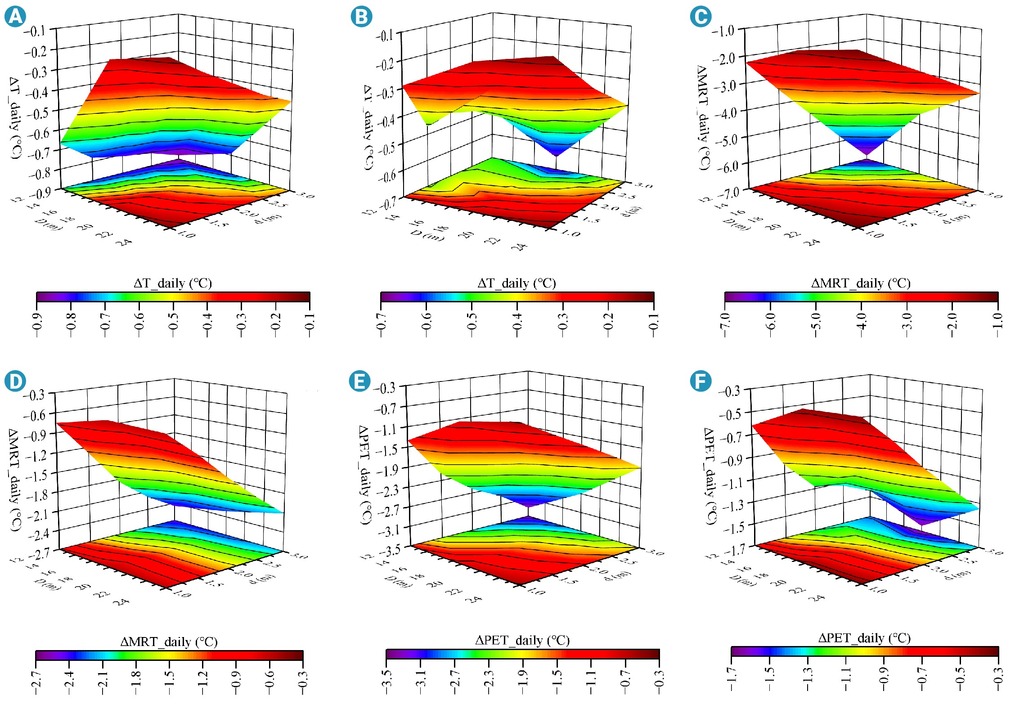
Response surface of daily mean air temperature difference (°C) as a function of D and d: (A) for east-west streets, (B) for north-south streets. Response surface of daily mean radiant temperature difference (°C) as a function of D and d: (C) for east-west streets, (D) for north-south streets. Response surface of daily mean physiological equivalent temperature (°C) as a function of D and d: (E) for east-west streets, (F) for north-south streets