
Land constraint makes solar trackers less effective for photovoltaic power generation
-
GRAPHICAL ABSTRACT
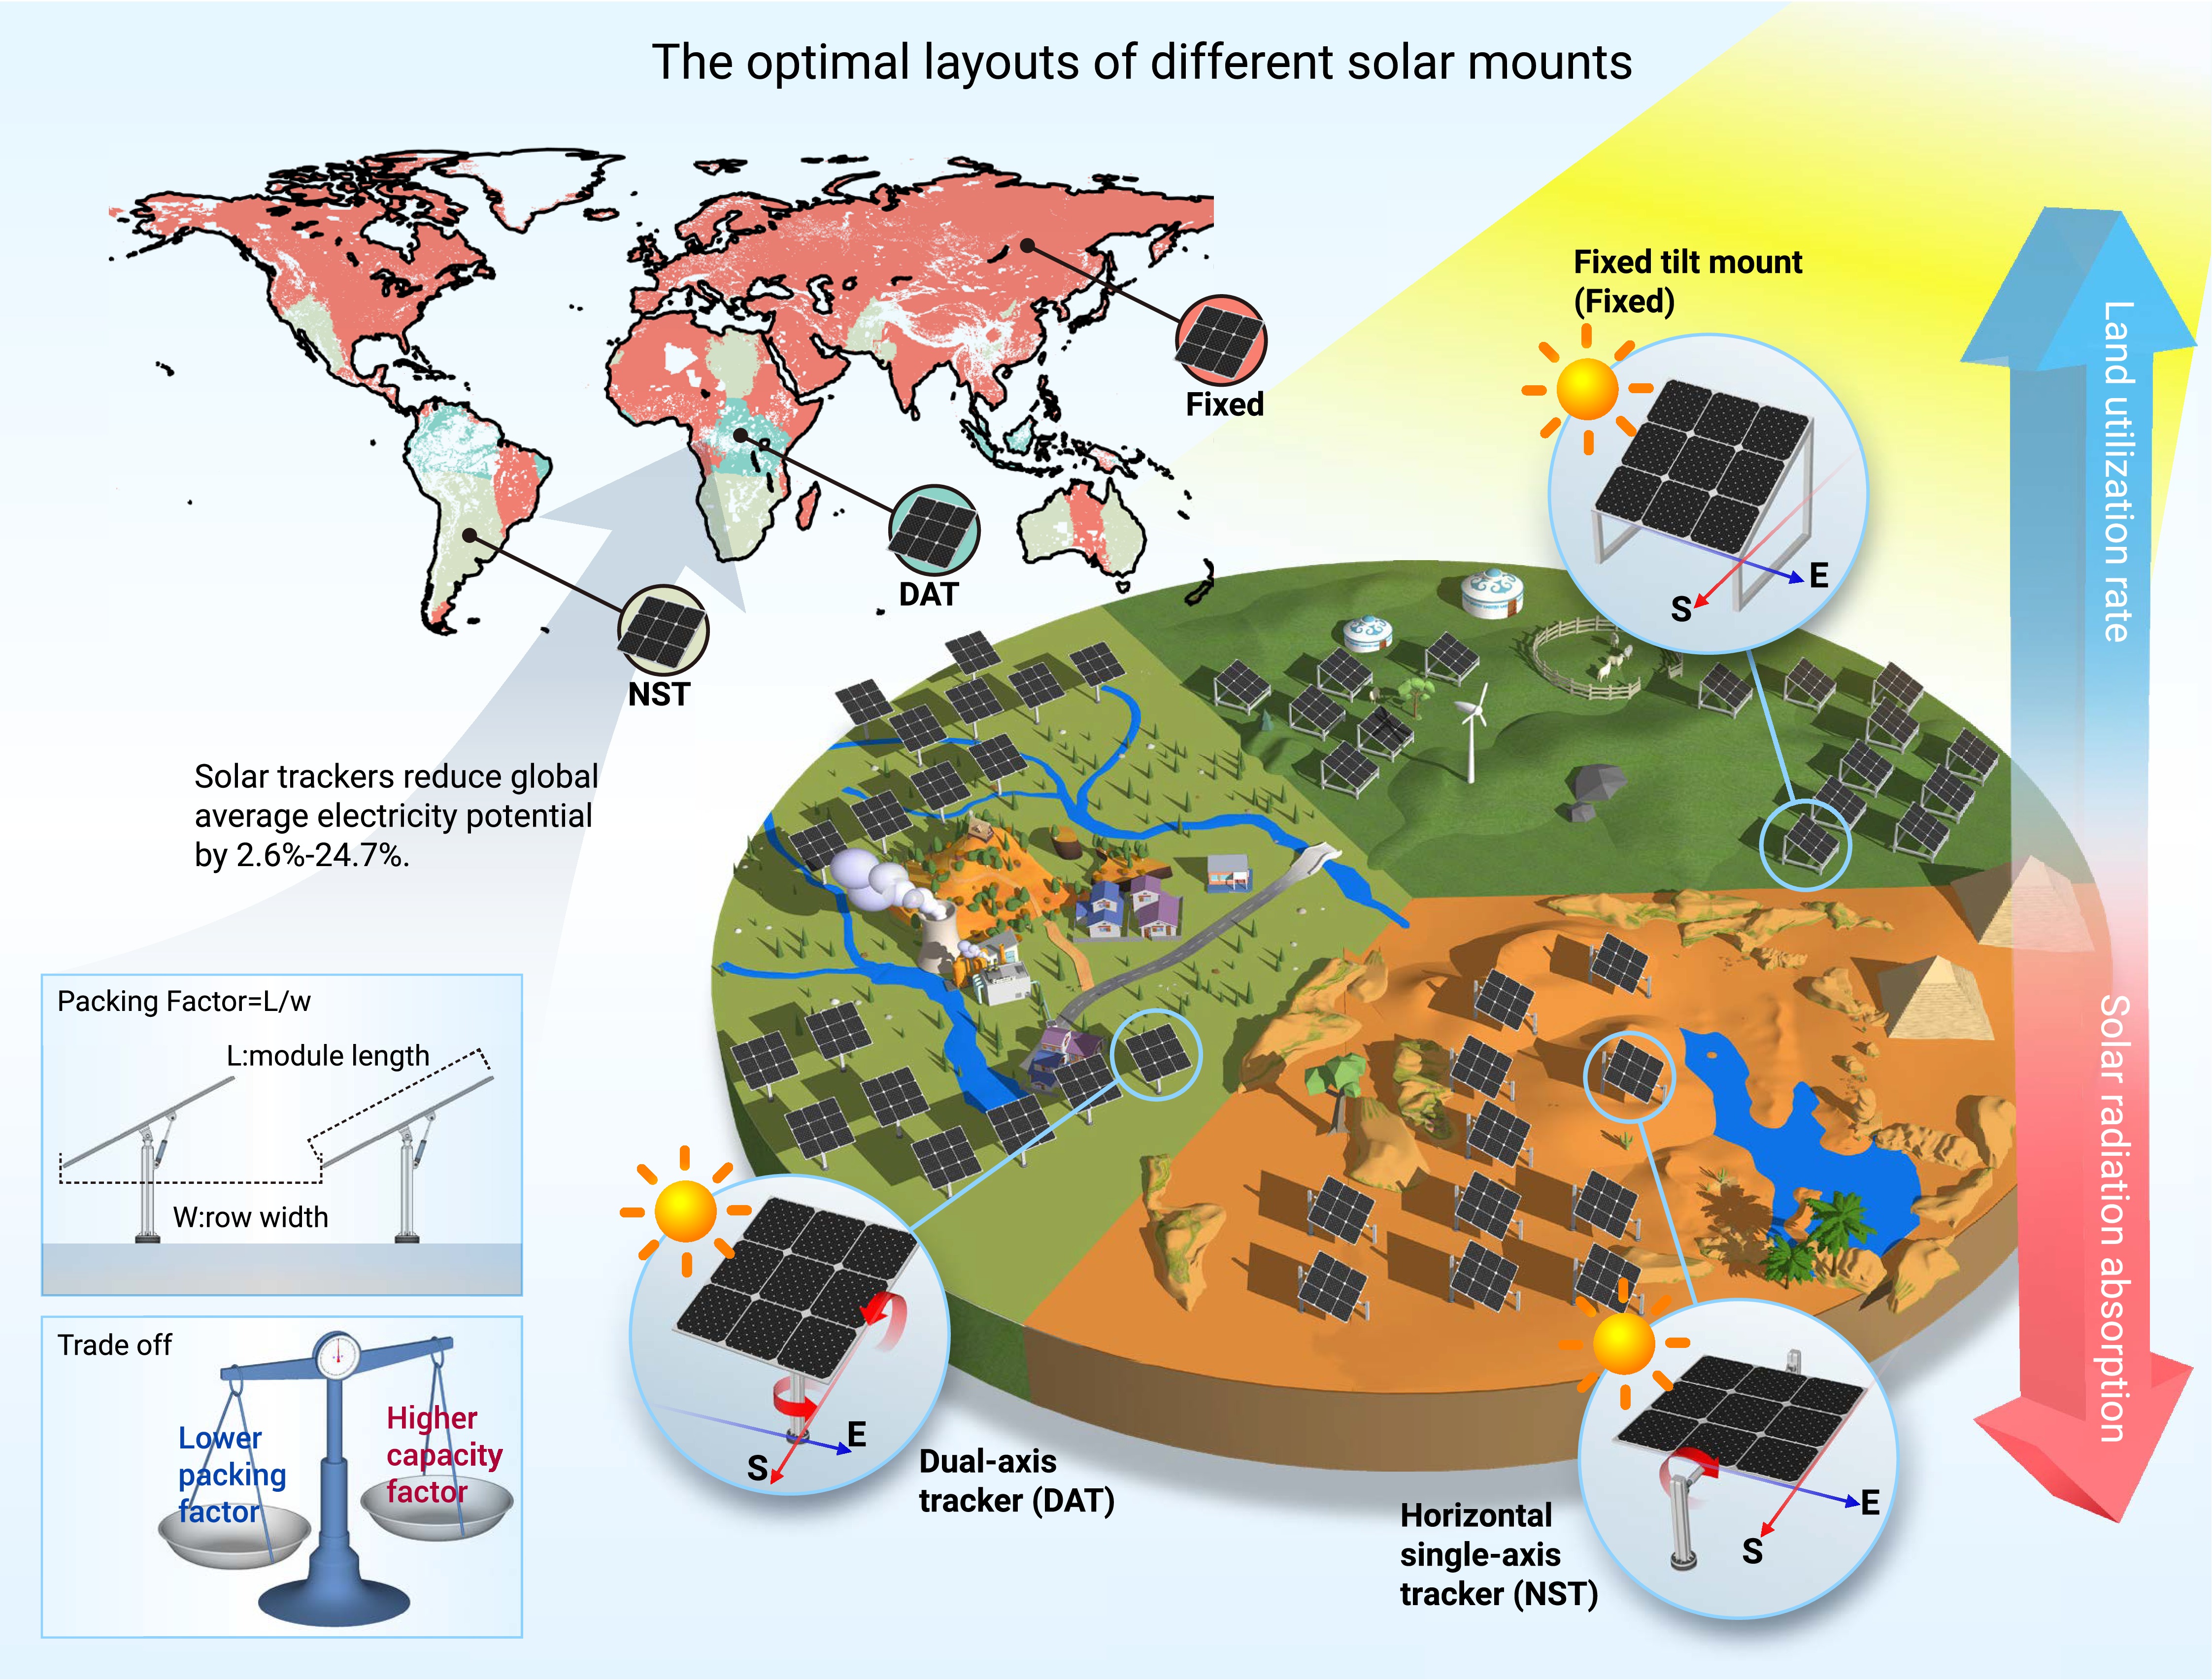
 DownLoad:
Full size image
DownLoad:
Full size image
-
PUBLIC SUMMARY
-
Solar trackers increase capacity factor but reduce installed capacity.
Using solar trackers causes a decline in global total electricity.
Fixed panels dominate most of the world for maximizing electricity potential.
A global mismatch between solar energy potential and electricity demands exists.
-
-
ABSTRACT
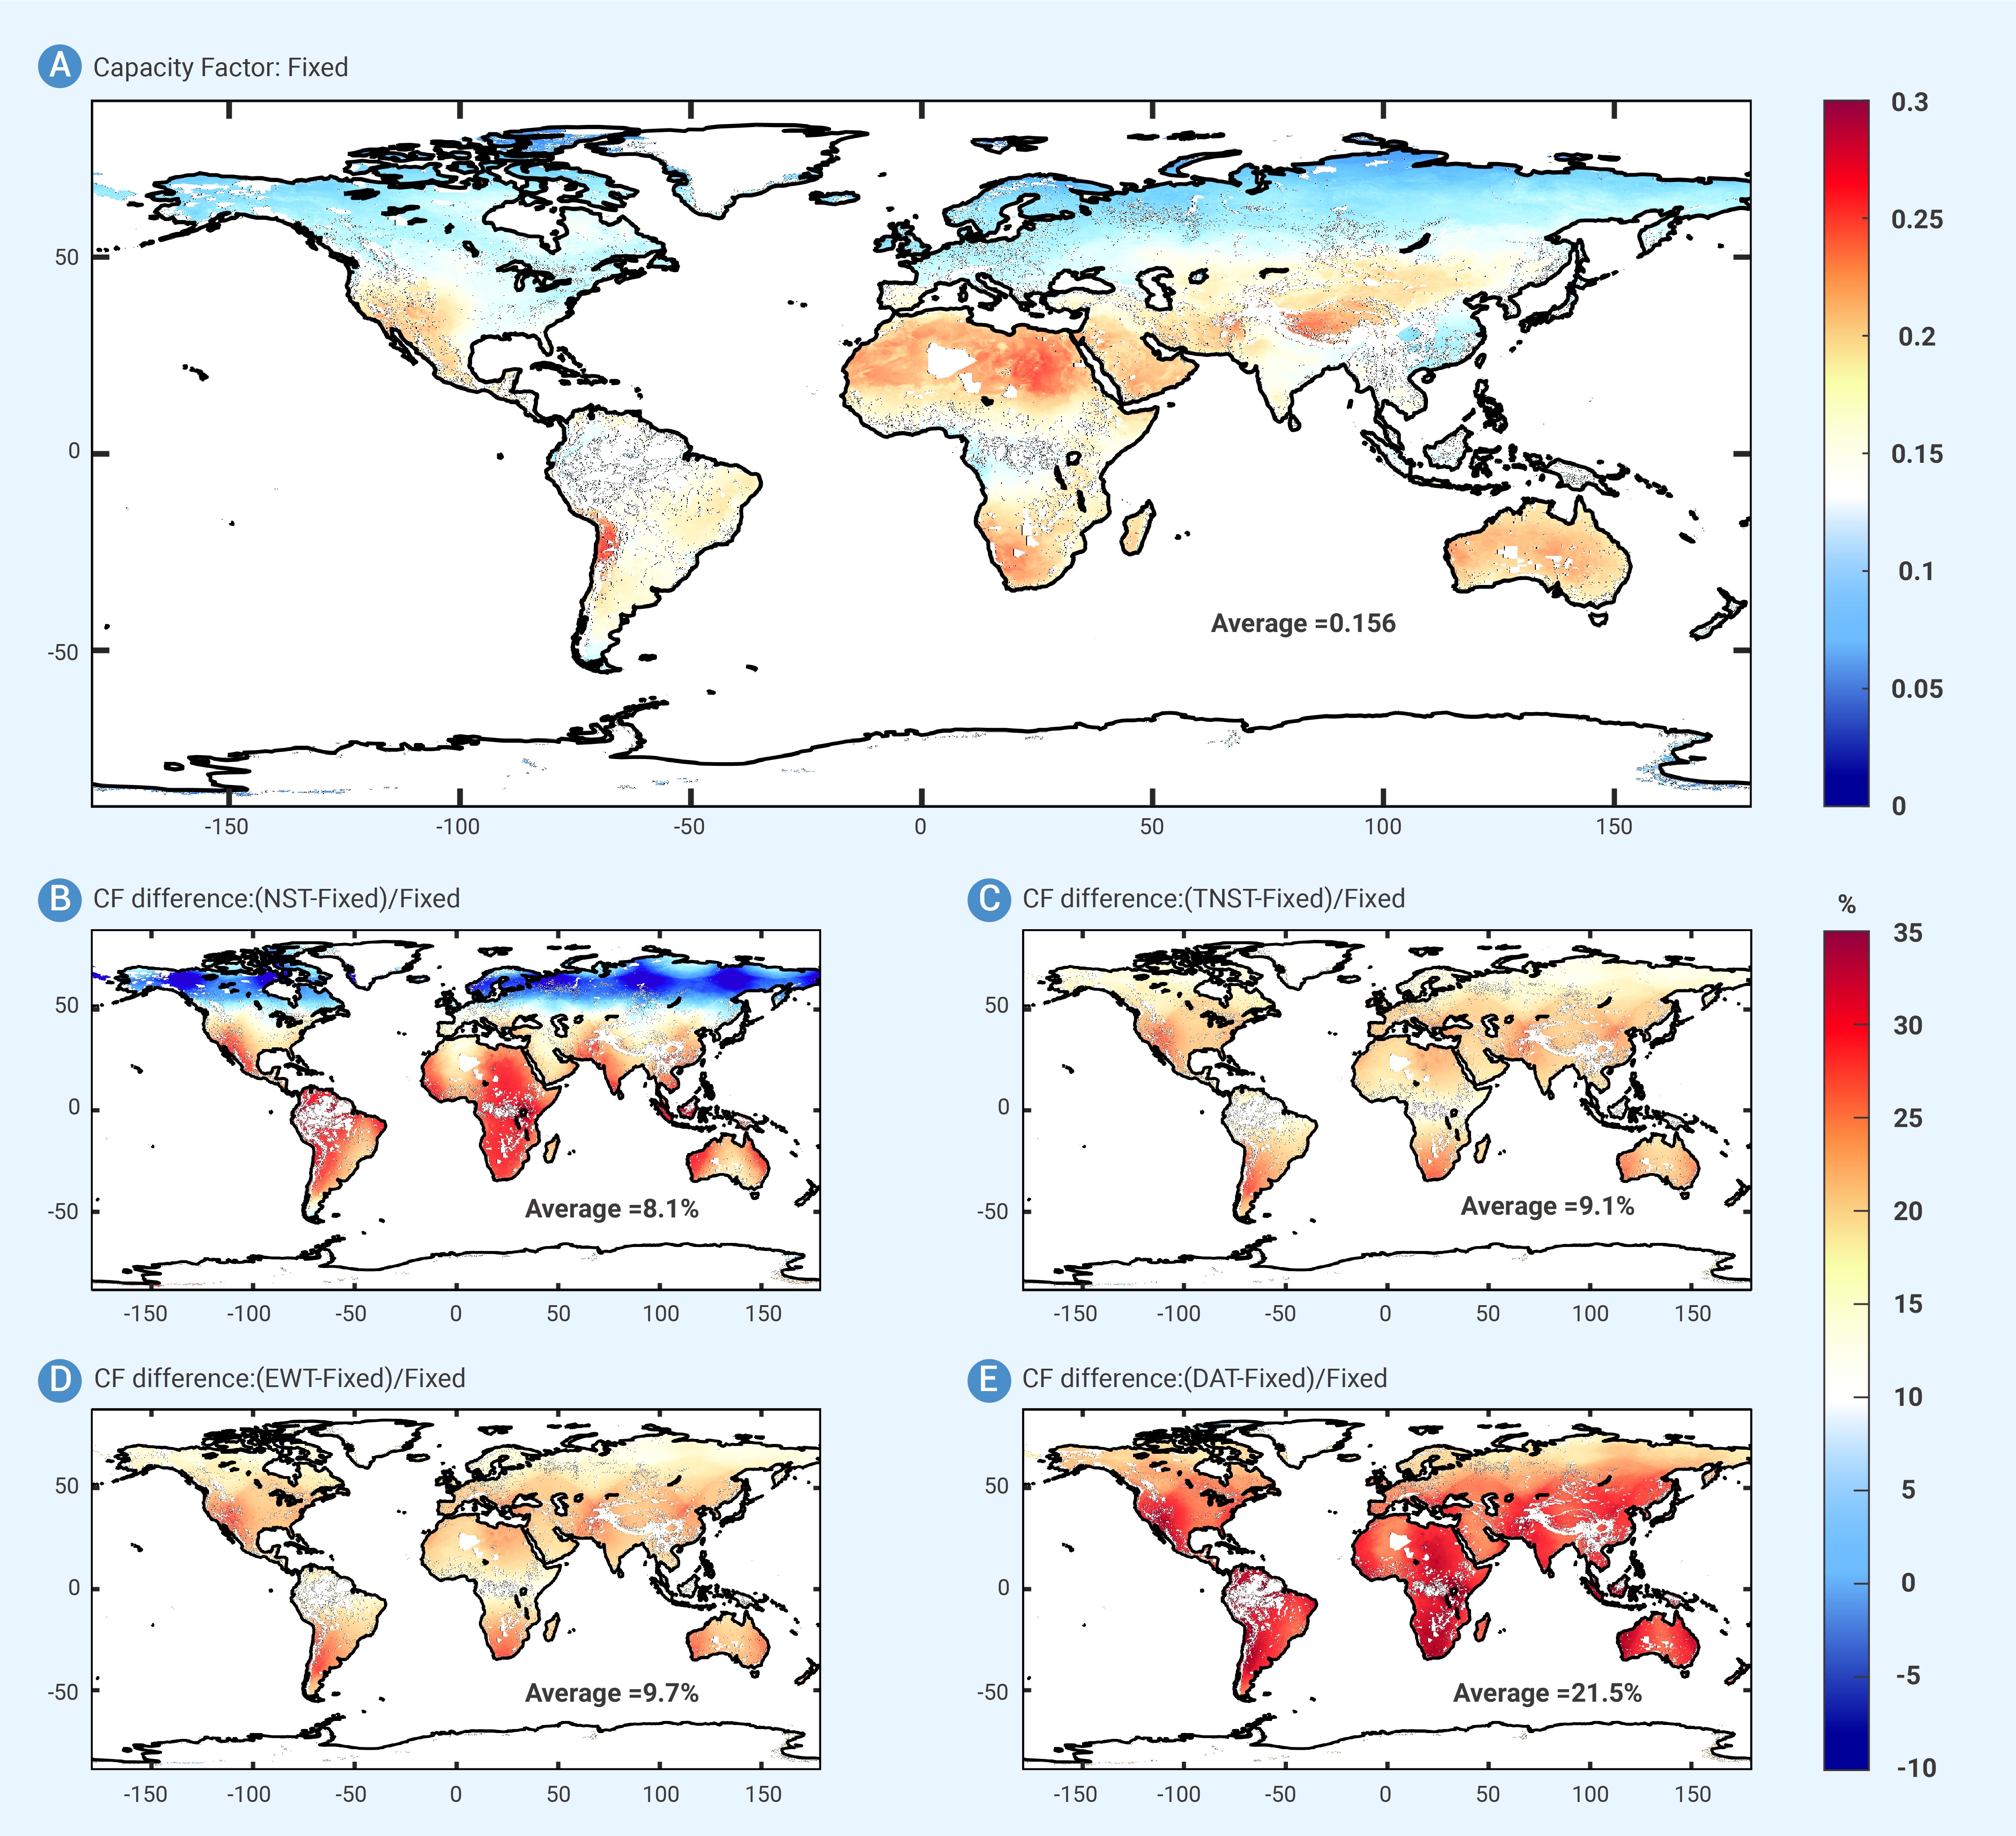
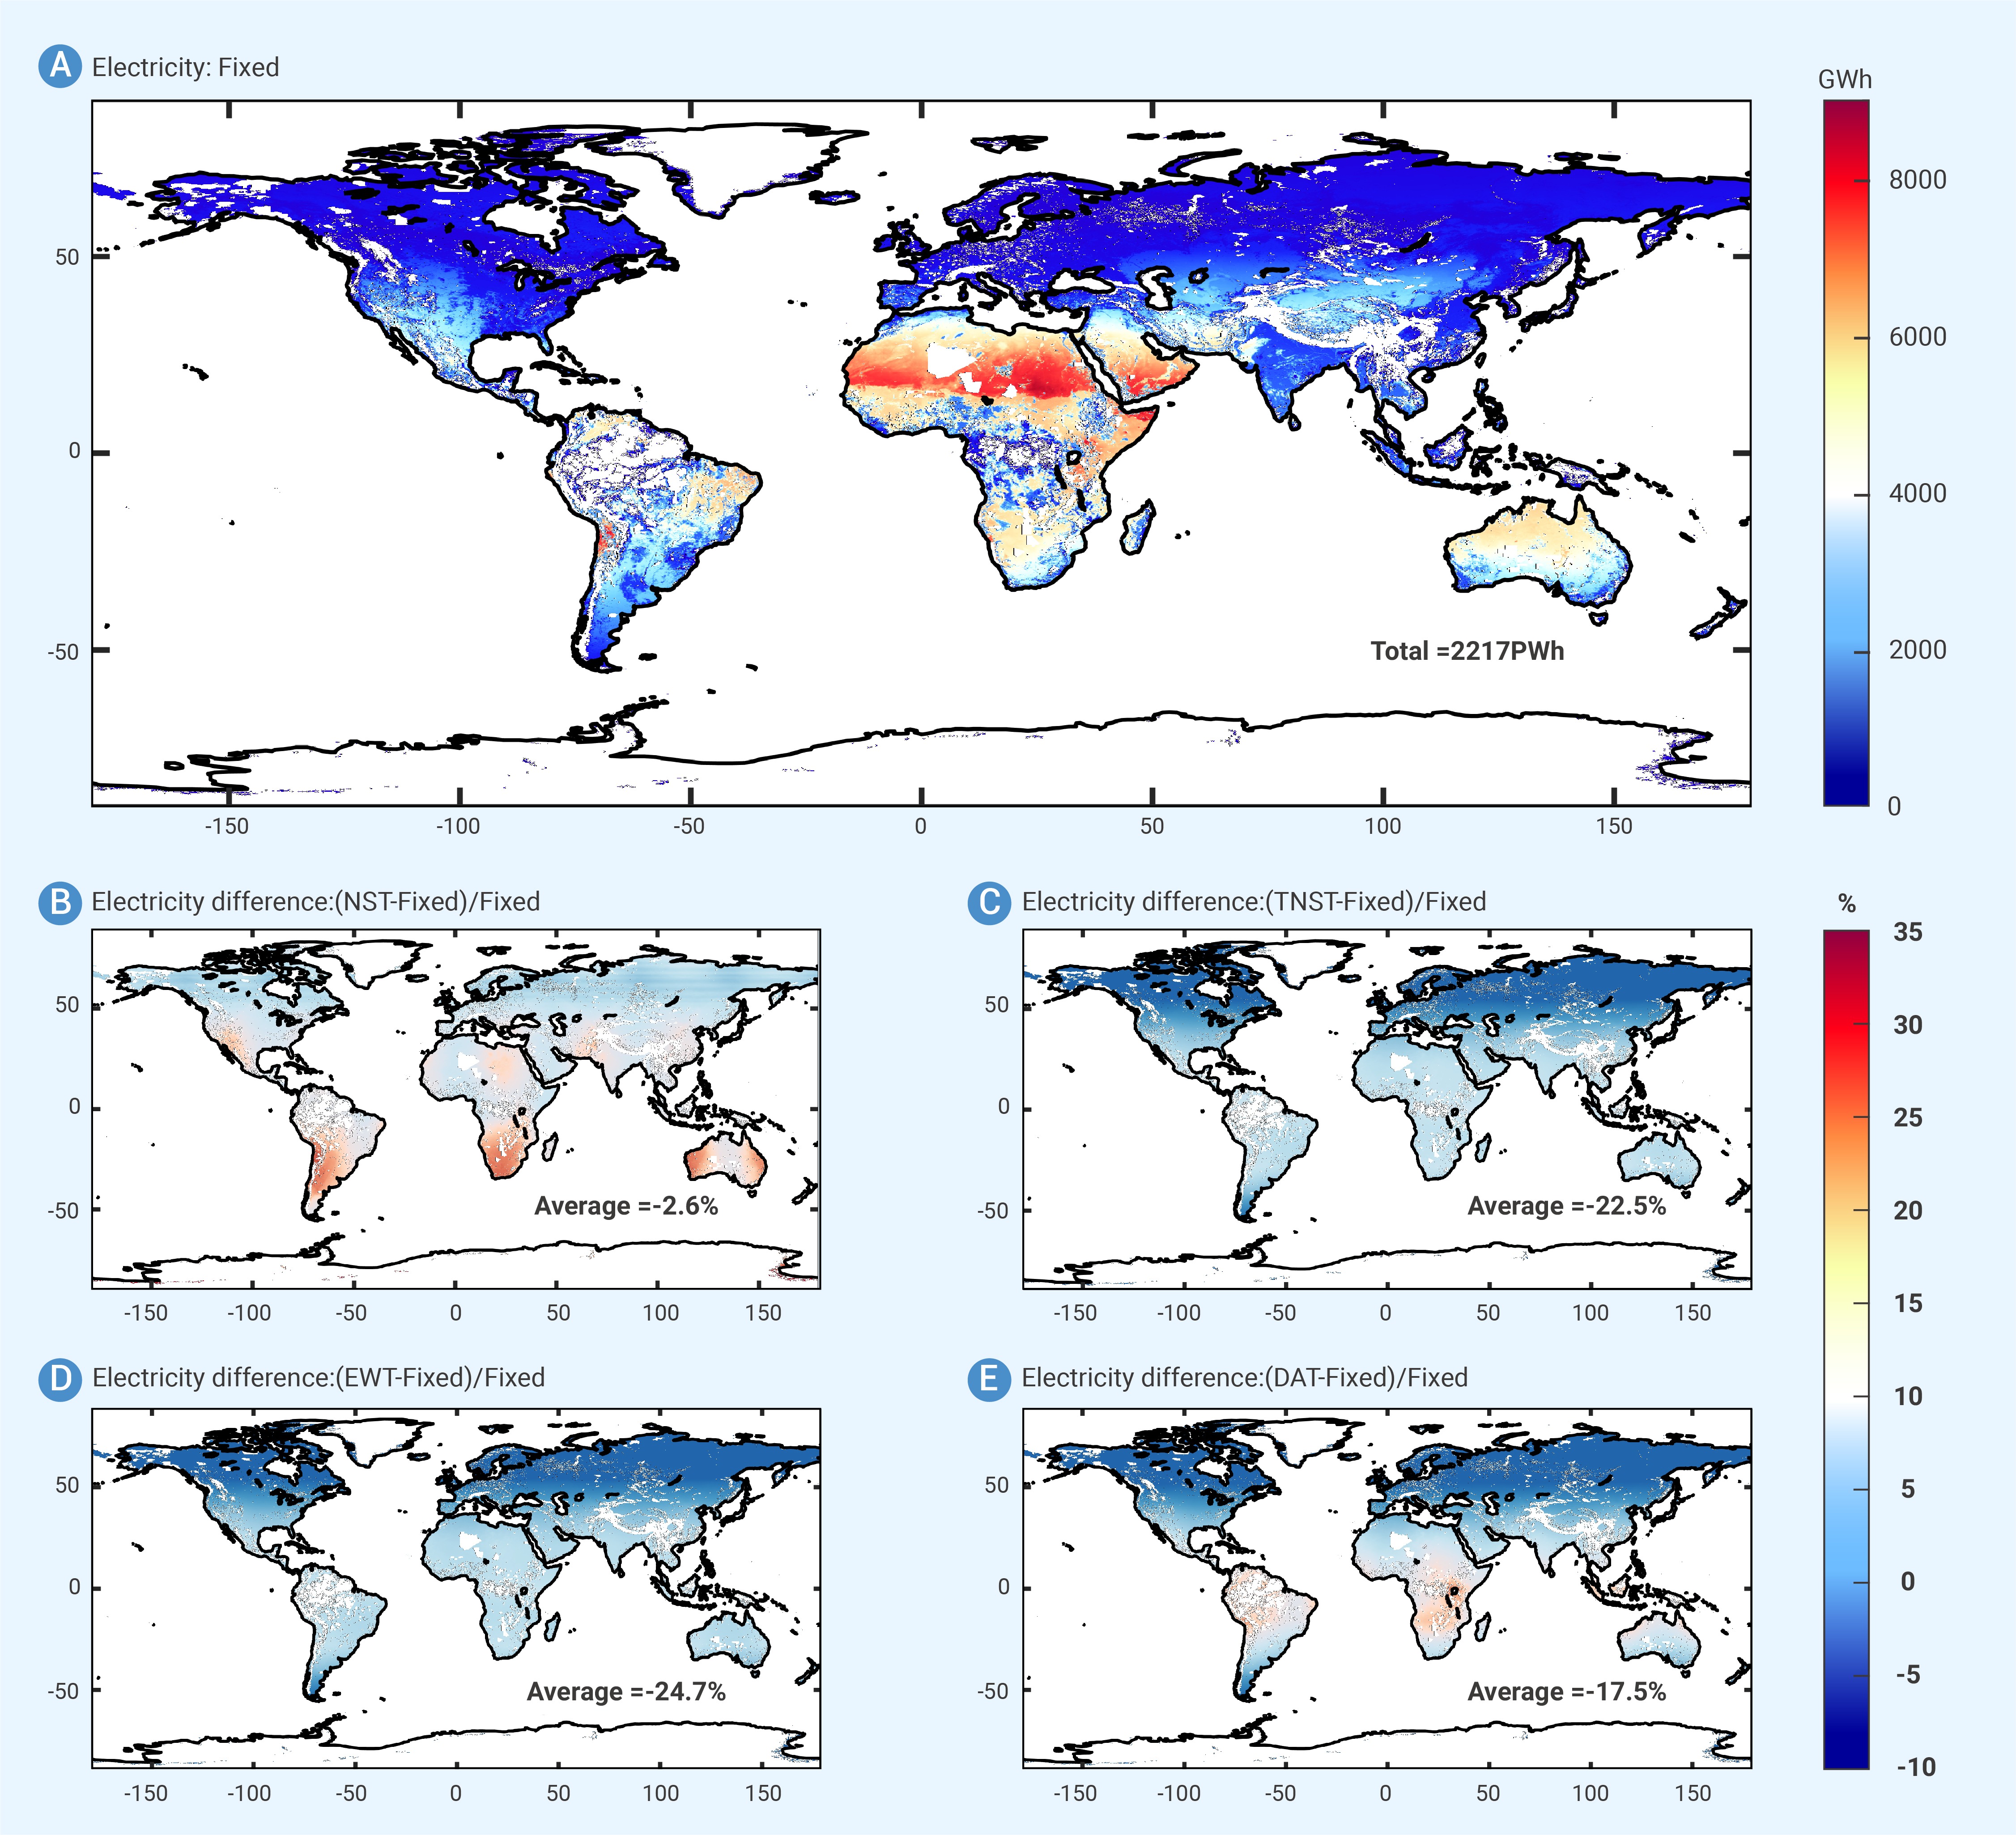
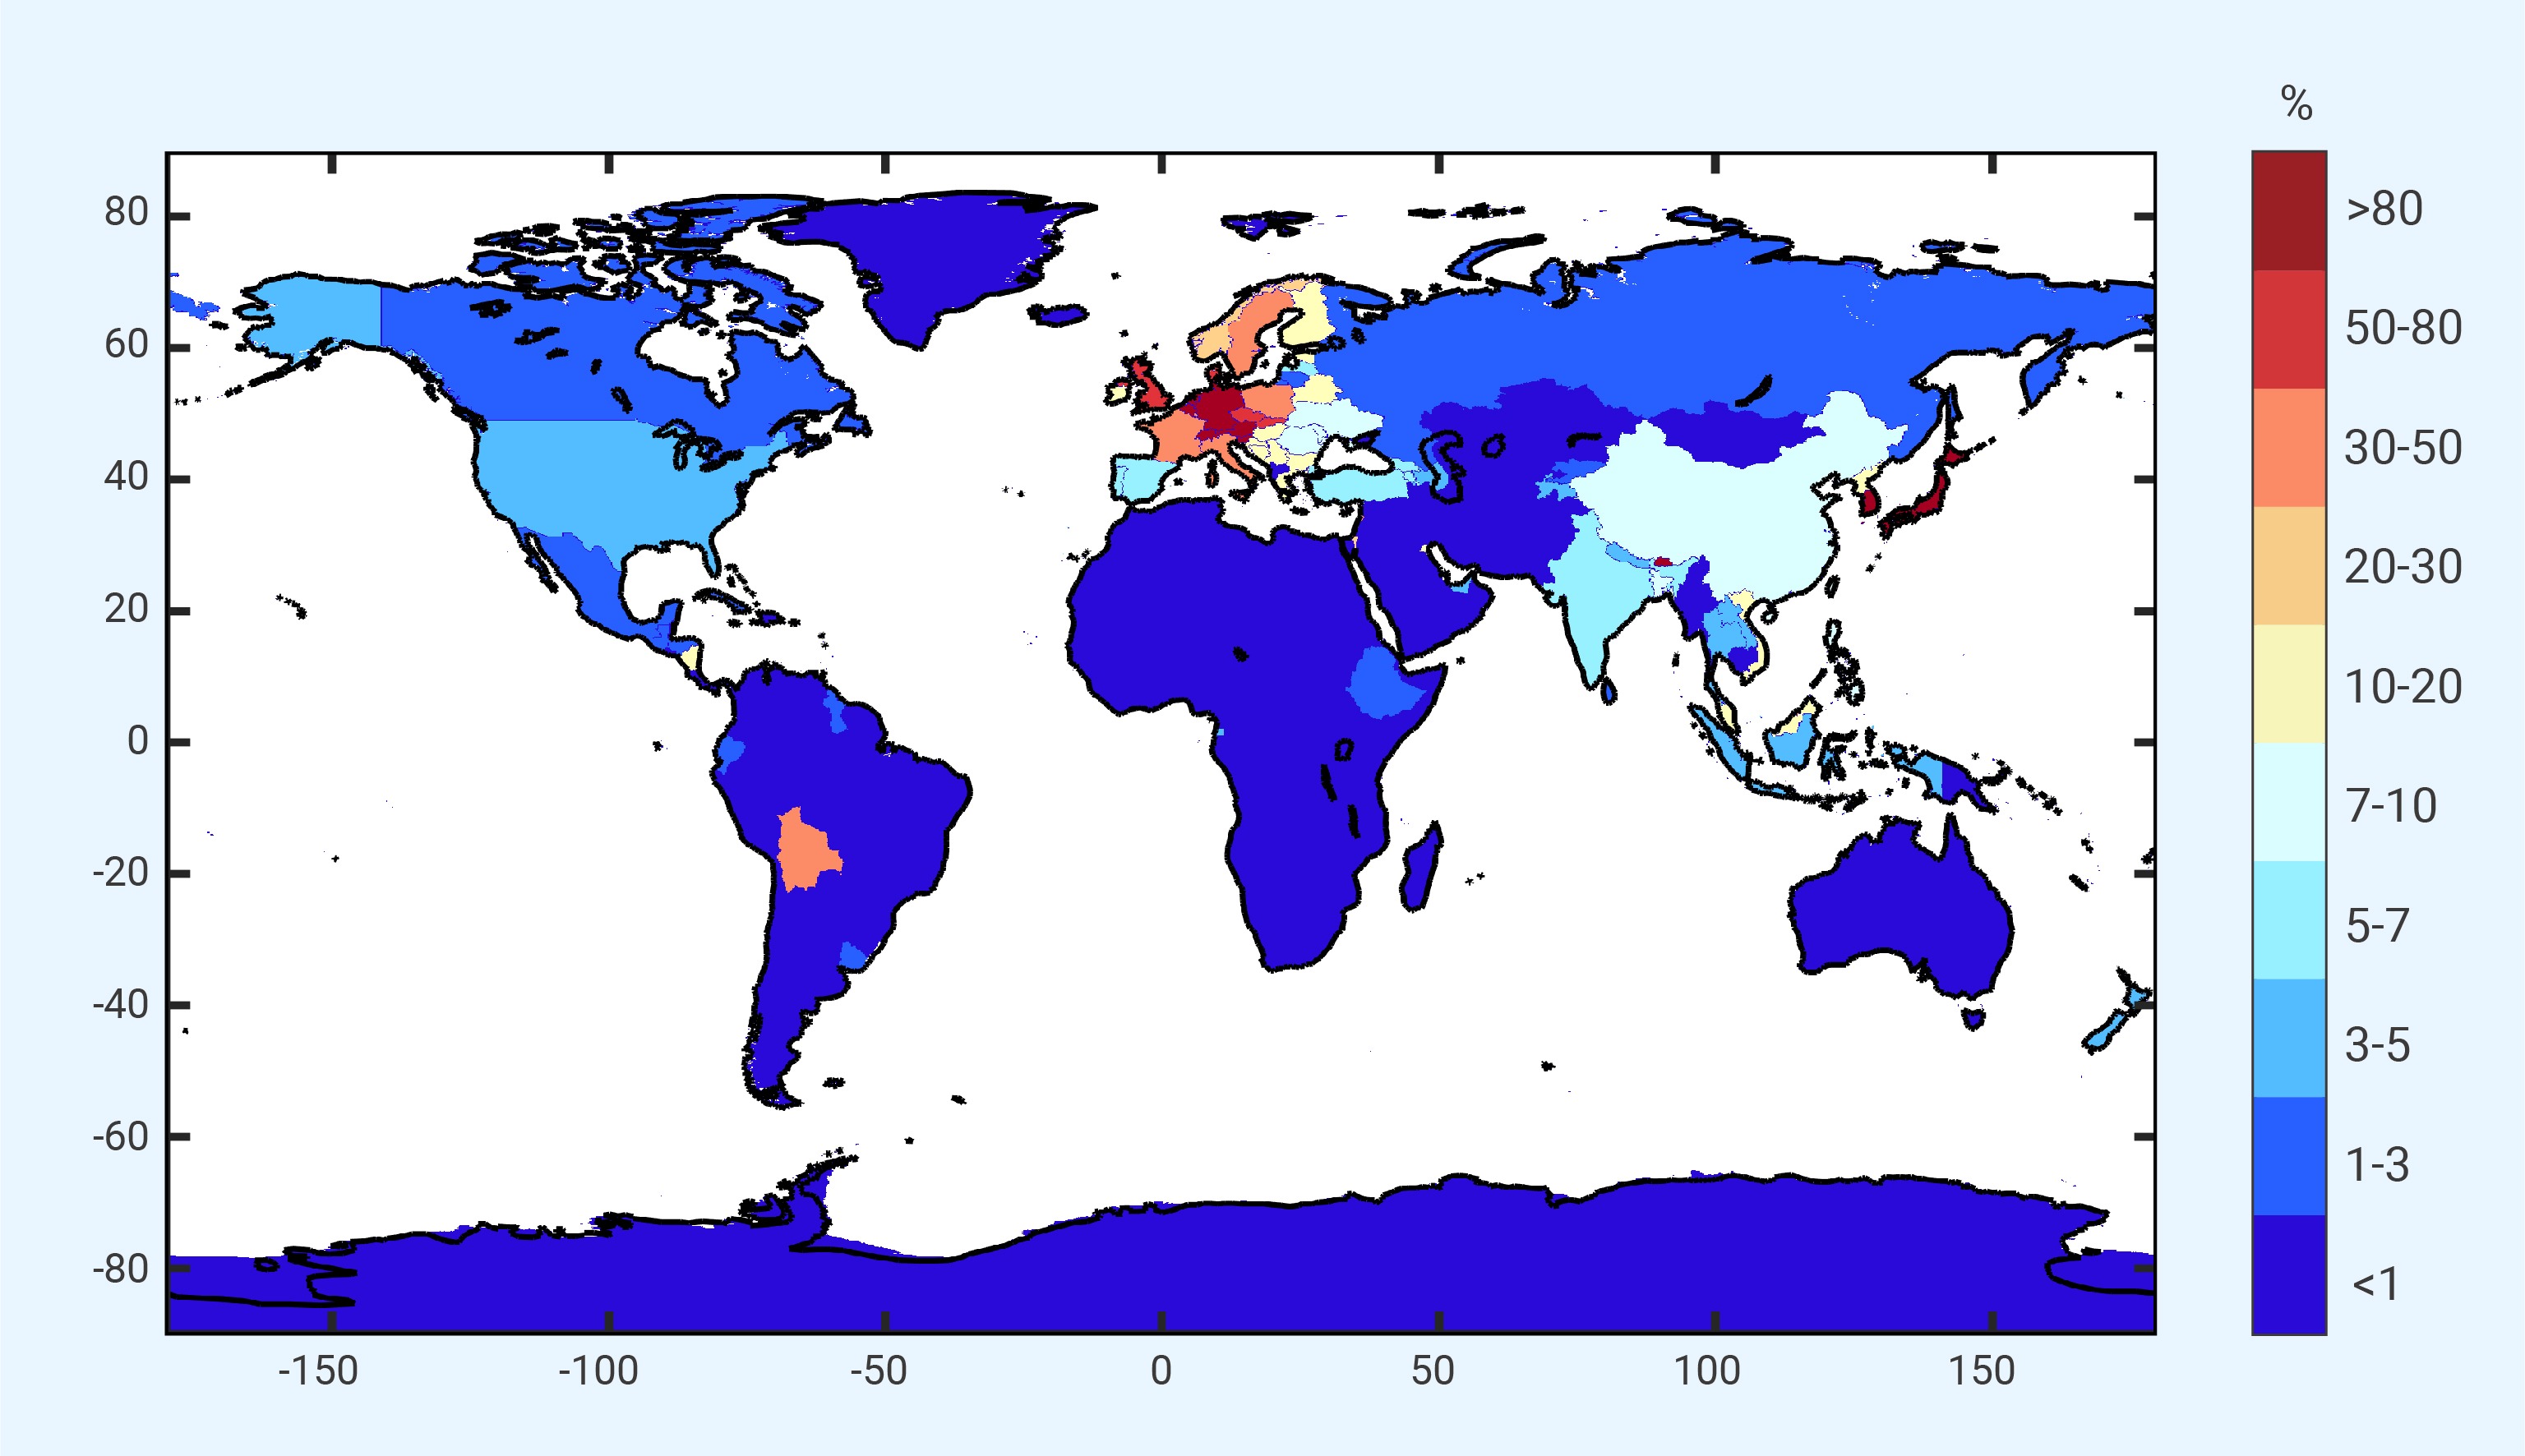
Unprecedented photovoltaic (PV) expansion makes land used for solar farms more limited and costly. Packing factors (ground cover ratio) of PV modules may become a key constraint for solar potential assessment, especially for solar trackers that require more land areas for deployment. This constraint is often neglected previously. This study re-assesses the global electricity generation potential of different solar trackers considering packing factor to judge their suitability. A physical model chain was used to convert irradiance to power. Generally, solar trackers help to utilize more radiation, thus increasing global average capacity factor by 8.1 % - 21.5 %, depending on solar tracker type. However, using solar trackers causes smaller packing factor and thus reduces installation density, consequently reducing global total electricity potential by 2.6 – 24.7 %, compared to fixed mounts. This tradeoff is spatially variable, and horizontal single-axis tracker (NST) and dual-axis tracker (DAT) can increase electricity by 5%-10% at mid- and low-latitudes, respectively. To maximize electricity potential, fixed mounts dominate most of the world, and DAT and NST perform better near the equator and at mid-latitudes, respectively. With the optimal solar module deployment, 107 countries can meet electricity demands by developing less than 5 % of their potential, while 17 countries cannot do it even if more than 50 % of their potential are developed, and need other measures like distributed PV to bridge the electricity gap. This study contributes greatly to clarifying the global suitability of solar trackers in land-constraint situations and guiding national and international PV development. -

-
REFERENCES
[1] van Ruijven B. J., De Cian E. and Sue Wing I. (2019). Amplification of future energy demand growth due to climate change. Nat. Commun. 10:2762. DOI:10.1038/s41467-019-10399-3 [2] Helveston J. P., He G. and Davidson M. R. (2022). Quantifying the cost savings of global solar photovoltaic supply chains. Nature 612:83−87. DOI:10.1038/s41586-022-05316-6 [3] Hosseini Dehshiri S. S. and Firoozabadi B. (2023). Comparison, evaluation and prioritization of solar photovoltaic tracking systems using multi criteria decision making methods. Sustain. Energy Tech. Assess. 55:102989. DOI:10.1016/j.seta.2022.102989 [4] Rodríguez-Gallegos C. D., Bieri M., Gandhi O., et al. (2018). Monofacial vs bifacial Si-based PV modules: Which one is more cost-effective? Solar Energy 176:412-438. DOI:10.1016/j.solener.2018.10.012 [5] Pelaez S. A., Deline C., Macalpine S. M., et al. (2019). Comparison of Bifacial Solar Irradiance Model Predictions With Field Validation. IEEE Photovolt. 9:82−88. DOI:10.1109/jphotov.2018.2877000 [6] Awasthi A., Shukla A. K., S.R M. M., et al. (2020). Review on sun tracking technology in solar PV system. Energy Rep. 6:392-405. DOI:10.1016/j.egyr.2020.02.004 [7] Sun X., Khan M. R., Deline C., et al. (2018). Optimization and performance of bifacial solar modules: A global perspective. Appl. Energy 212:1601-1610. DOI:10.1016/j.apenergy.2017.12.041 [8] Rodríguez-Gallegos C. D., Liu H., Gandhi O., et al. (2020). Global Techno-Economic Performance of Bifacial and Tracking Photovoltaic Systems. Joule 4:1514-1541. DOI:10.1016/j.joule.2020.05.005 [9] Bahrami A., Okoye C. O. and Atikol U. (2016). The effect of latitude on the performance of different solar trackers in Europe and Africa. Appl. Energy 177:896-906. DOI:10.1016/j.apenergy.2016.05.103 [10] Bahrami A., Okoye C. O. and Atikol U. (2017). Technical and economic assessment of fixed, single and dual-axis tracking PV panels in low latitude countries. Renew. Energy 113:563-579. DOI:10.1016/j.renene.2017.05.095 [11] Bolinger M. and Bolinger G. (2022). Land Requirements for Utility-Scale PV: An Empirical Update on Power and Energy Density. IEEE Photovolt. 12:589−594. DOI:10.1109/jphotov.2021.3136805 [12] Kafka J. and Miller M. A. (2020). The dual angle solar harvest (DASH) method: An alternative method for organizing large solar panel arrays that optimizes incident solar energy in conjunction with land use. Renew. Energy 155:531-546. DOI:10.1016/j.renene.2020.03.025 [13] Raina G. and Sinha S. (2022). A holistic review approach of design considerations, modelling, challenges and future applications for bifacial photovoltaics. Energy Conver. Manag. 271:116290. DOI:10.1016/j.enconman.2022.116290 [14] Berrian D., Libal J., Klenk M., et al. (2019). Performance of Bifacial PV Arrays With Fixed Tilt and Horizontal Single-Axis Tracking: Comparison of Simulated and Measured Data. IEEE Photovolt. 9:1583−1589. DOI:10.1109/JPHOTOV.2019.2924394 [15] Tonita E. M., Russell A. C. J., Valdivia C. E., et al. (2023). Optimal ground coverage ratios for tracked, fixed-tilt, and vertical photovoltaic systems for latitudes up to 75°N. Solar Energy 258:8-15. DOI:10.1016/j.solener.2023.04.038 [16] Joshi S., Mittal S., Holloway P., et al. (2021). High resolution global spatiotemporal assessment of rooftop solar photovoltaics potential for renewable electricity generation. Nat. Commun. 12:5738. DOI:10.1038/s41467-021-25720-2 [17] Prăvălie R., Patriche C. and Bandoc G. (2019). Spatial assessment of solar energy potential at global scale. A geographical approach. J. Clean. Product. 209:692-721. DOI:10.1016/j.jclepro.2018.10.239 [18] Tong D., Farnham D. J., Duan L., et al. (2021). Geophysical constraints on the reliability of solar and wind power worldwide. Nat. Commun. 12. DOI:10.1038/s41467-021-26355-z [19] Shao C., Yang K., Tang W., et al. (2022). Convolutional neural network-based homogenization for constructing a long-term global surface solar radiation dataset. Renew. Sustain. Energy Rev. 169:112952. DOI:10.1016/j.rser.2022.112952 [20] Zhang X., Liang S., Wang G., et al. (2016). Evaluation of the Reanalysis Surface Incident Shortwave Radiation Products from NCEP, ECMWF, GSFC, and JMA Using Satellite and Surface Observations. Remote Sensing 8:225. DOI:10.3390/rs8030225 [21] Tang W., Yang K., Qin J., et al. (2019). A 16-year dataset (2000–2015) of high-resolution (3 h, 10 km) global surface solar radiation. Earth Sys. Sci. Data 11:1905−1915. DOI:10.5194/essd-11-1905-2019 [22] Shao C., Yang K., Jiang Y., et al. (2024). Data Augmentation-Based Estimation of Solar Radiation Components without Referring to Local Ground Truth in China. J. Remote Sensing 4:0111. DOI:10.34133/remotesensing.0111 [23] Tang W., He J., Shao C., et al. (2024). Constructing a long-term global dataset of direct and diffuse radiation (10 km, 3 h, 1983–2018) separating from the satellite-based estimates of global radiation. Remote Sensing Environ. 311:114292. DOI:10.1016/j.rse.2024.114292 [24] Hersbach H., Bell B., Berrisford P., et al. (2020). The ERA5 global reanalysis. Quarterly J. Royal Meteorol. Soc. 146:1999−2049. DOI:10.1002/qj.3803 [25] Schaaf C. B., Gao F., Strahler A. H., et al. (2002). First operational BRDF, albedo nadir reflectance products from MODIS. Remote Sensing Environ. 83:135-148. DOI:10.1016/S0034-4257(02)00091-3 [26] Friedl M. S.-M., D. (2019). MCD12Q1 MODIS/Terra+Aqua Land Cover Type Yearly L3 Global 500m SIN Grid V006. In M. Friedl, Sulla-Menashe, D., ed. [27] Jacobson M. Z., Delucchi M. A., Bauer Z. A. F., et al. (2017). 100% Clean and Renewable Wind, Water, and Sunlight All-Sector Energy Roadmaps for 139 Countries of the World. Joule 1:108-121. DOI:10.1016/j.joule.2017.07.005 [28] Heusinger J., Broadbent A. M., Sailor D. J., et al. (2020). Introduction, evaluation and application of an energy balance model for photovoltaic modules. Solar Energy 195:382-395. DOI:10.1016/j.solener.2019.11.041 [29] Chen S., Lu X., Miao Y., et al. (2019). The Potential of Photovoltaics to Power the Belt and Road Initiative. Joule 3:1895-1912. DOI:10.1016/j.joule.2019.06.006 [30] Hong T., Pinson P., Wang Y., et al. (2020). Energy Forecasting: A Review and Outlook. IEEE Open Access J. Power Energy 7:376−388. DOI:10.1109/oajpe.2020.3029979 [31] Wang W., Yang D., Huang N., et al. (2022). Irradiance-to-power conversion based on physical model chain: An application on the optimal configuration of multi-energy microgrid in cold climate. Renew. Sustain. Energy Rev. 161:112356. DOI:10.1016/j.rser.2022.112356 [32] King D., Kratochvil J. and Boyson W. (2004). Photovoltaic Array Performance Model. Sandia Rep.2004:3535. https://www.osti.gov/servlets/purl/919131 [33] Duffie J.A. and Beckman W.A. (2013). Solar Engineering of Thermal Processes. (4th Edition). John Wiley Sons, New York 3:42. https://doi.org/10.1002/9781118671603.ch1 [34] Arias-Rosales A. and Leduc P. R. (2020). Comparing View Factor modeling frameworks for the estimation of incident solar energy. Appl. Energy 277:115510. DOI:10.1016/j.apenergy.2020.115510 [35] Appelbaum J. (2016). Bifacial photovoltaic panels field. Renew. Energy 85:338-343. DOI:10.1016/j.renene.2015.06.050 [36] Masson V. R., Bonhomme M., Salagnac J.L., et al. (2014). Solar panels reduce both global warming and urban heat island. Front. Environ. Sci. 2. DOI:10.3389/fenvs.2014.00014 [37] Masson V. (2000). A Physically-Based Scheme For The Urban Energy Budget In Atmospheric Models. Boundary-Layer Meteorol. 94:357−397. DOI:10.1023/a:1002463829265 [38] F. Holmgren W., W. Hansen C. and A. Mikofski M. (2018). pvlib python: a python package for modeling solar energy systems. J. Open Source Soft. 3:884. DOI:10.21105/joss.00884 [39] Hachicha A. A., Al-Sawafta I. and Said Z. (2019). Impact of dust on the performance of solar photovoltaic (PV) systems under United Arab Emirates weather conditions. Renew. Energy 141:287-297. DOI:10.1016/j.renene.2019.04.004 [40] Wild P. (2016). Impact of module soiling on the productive performance of three solar PV technologies at gatton. 2016 Australasian Universities Power Engineering Conference (AUPEC). [41] Qiu T., Wang L., Lu Y., et al. (2022). Potential assessment of photovoltaic power generation in China. Renew. Sustain. Energy Rev. 154:111900. DOI:10.1016/j.rser.2021.111900 [42] Lopez-Lorente J., Neubert A. and Hamer M. (2024). Energy Yield Modeling of Single-Axis Tracking PV Systems on Irregular Terrain. 2024 PVSC. DOI:10.1109/PVSC57443.2024.10749568. [43] Burnham L., Riley D., Walker B., et al. (2019). Performance of Bifacial Photovoltaic Modules on a Dual-Axis Tracker in a High-Latitude, High-Albedo Environment. 2019 PVSC. DOI:10.1109/PVSC40753.2019.8980964. [44] Quesada G., Guillon L., Rousse D. R., et al. (2015). Tracking strategy for photovoltaic solar systems in high latitudes. Energy Conver. Manag. 103:147-156. DOI:10.1016/j.enconman.2015.06.041 [45] Jiang H., Yao L., Lu N., et al. (2024). Exploring the optimization of rooftop photovoltaic scale and spatial layout under curtailment constraints. Energy 293:130721. DOI:10.1016/j.energy.2024.130721 [46] Frew B., Sergi B., Denholm P., et al. (2021). The curtailment paradox in the transition to high solar power systems. Joule 5:1143-1167. DOI:10.1016/j.joule.2021.03.021 [47] Zhang X., Wang J.X., Cao Z., et al. (2021). What is driving the remarkable decline of wind and solar power curtailment in China? Evidence from China and four typical provinces. Renew. Energy 174:31-42. DOI:10.1016/j.renene.2021.04.043 -
ABOUT THIS ARTICLE
Cite this article:
Shao C., Yang K., Zhang X., et al. (2025). Land constraint makes solar trackers less effective for photovoltaic power generation. The Innovation Energy 2:100103. https://doi.org/10.59717/j.xinn-energy.2025.100103
Welcome!
To request copyright permission to republish or share portions of our works, please visit Copyright Clearance Center's (CCC) Marketplace website at marketplace.copyright.com.

Article Metrics
Relative Articles
Cited by
Export File
Citation
Shao C., Yang K., Zhang X., et al. (2025). Land constraint makes solar trackers less effective for photovoltaic power generation. The Innovation Energy 2:100103. https://doi.org/10.59717/j.xinn-energy.2025.100103

Format
Content


-
Figure 1.
Schematic diagram of different PV mounts
-
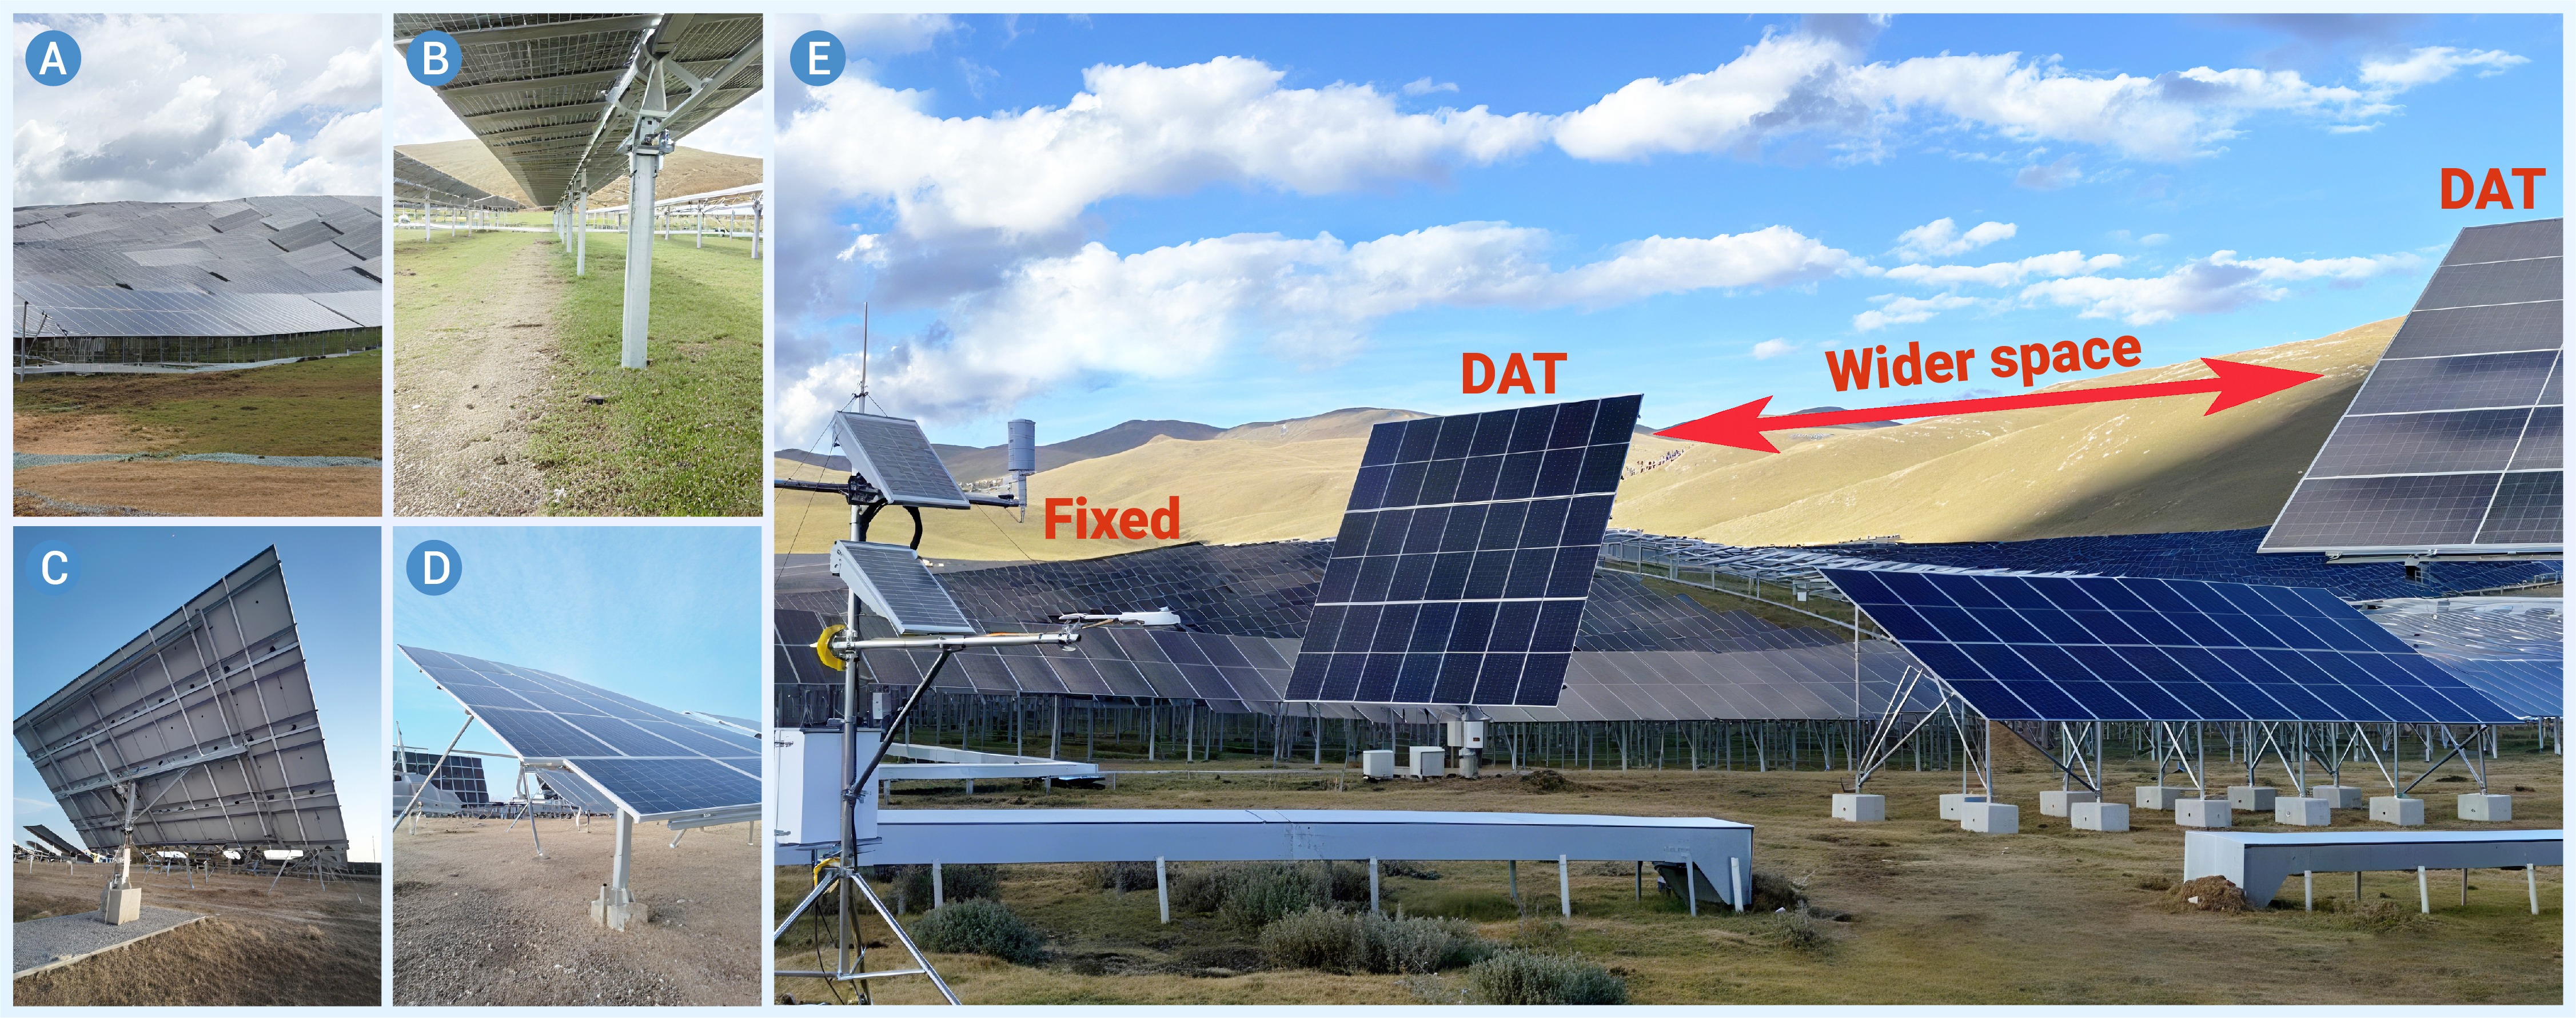
Figure 2.
Photos were taken by the authors at the Gonghe PV plant in Qinghai Province and the Xingchuan PV plant in Sichuan Province, China
-
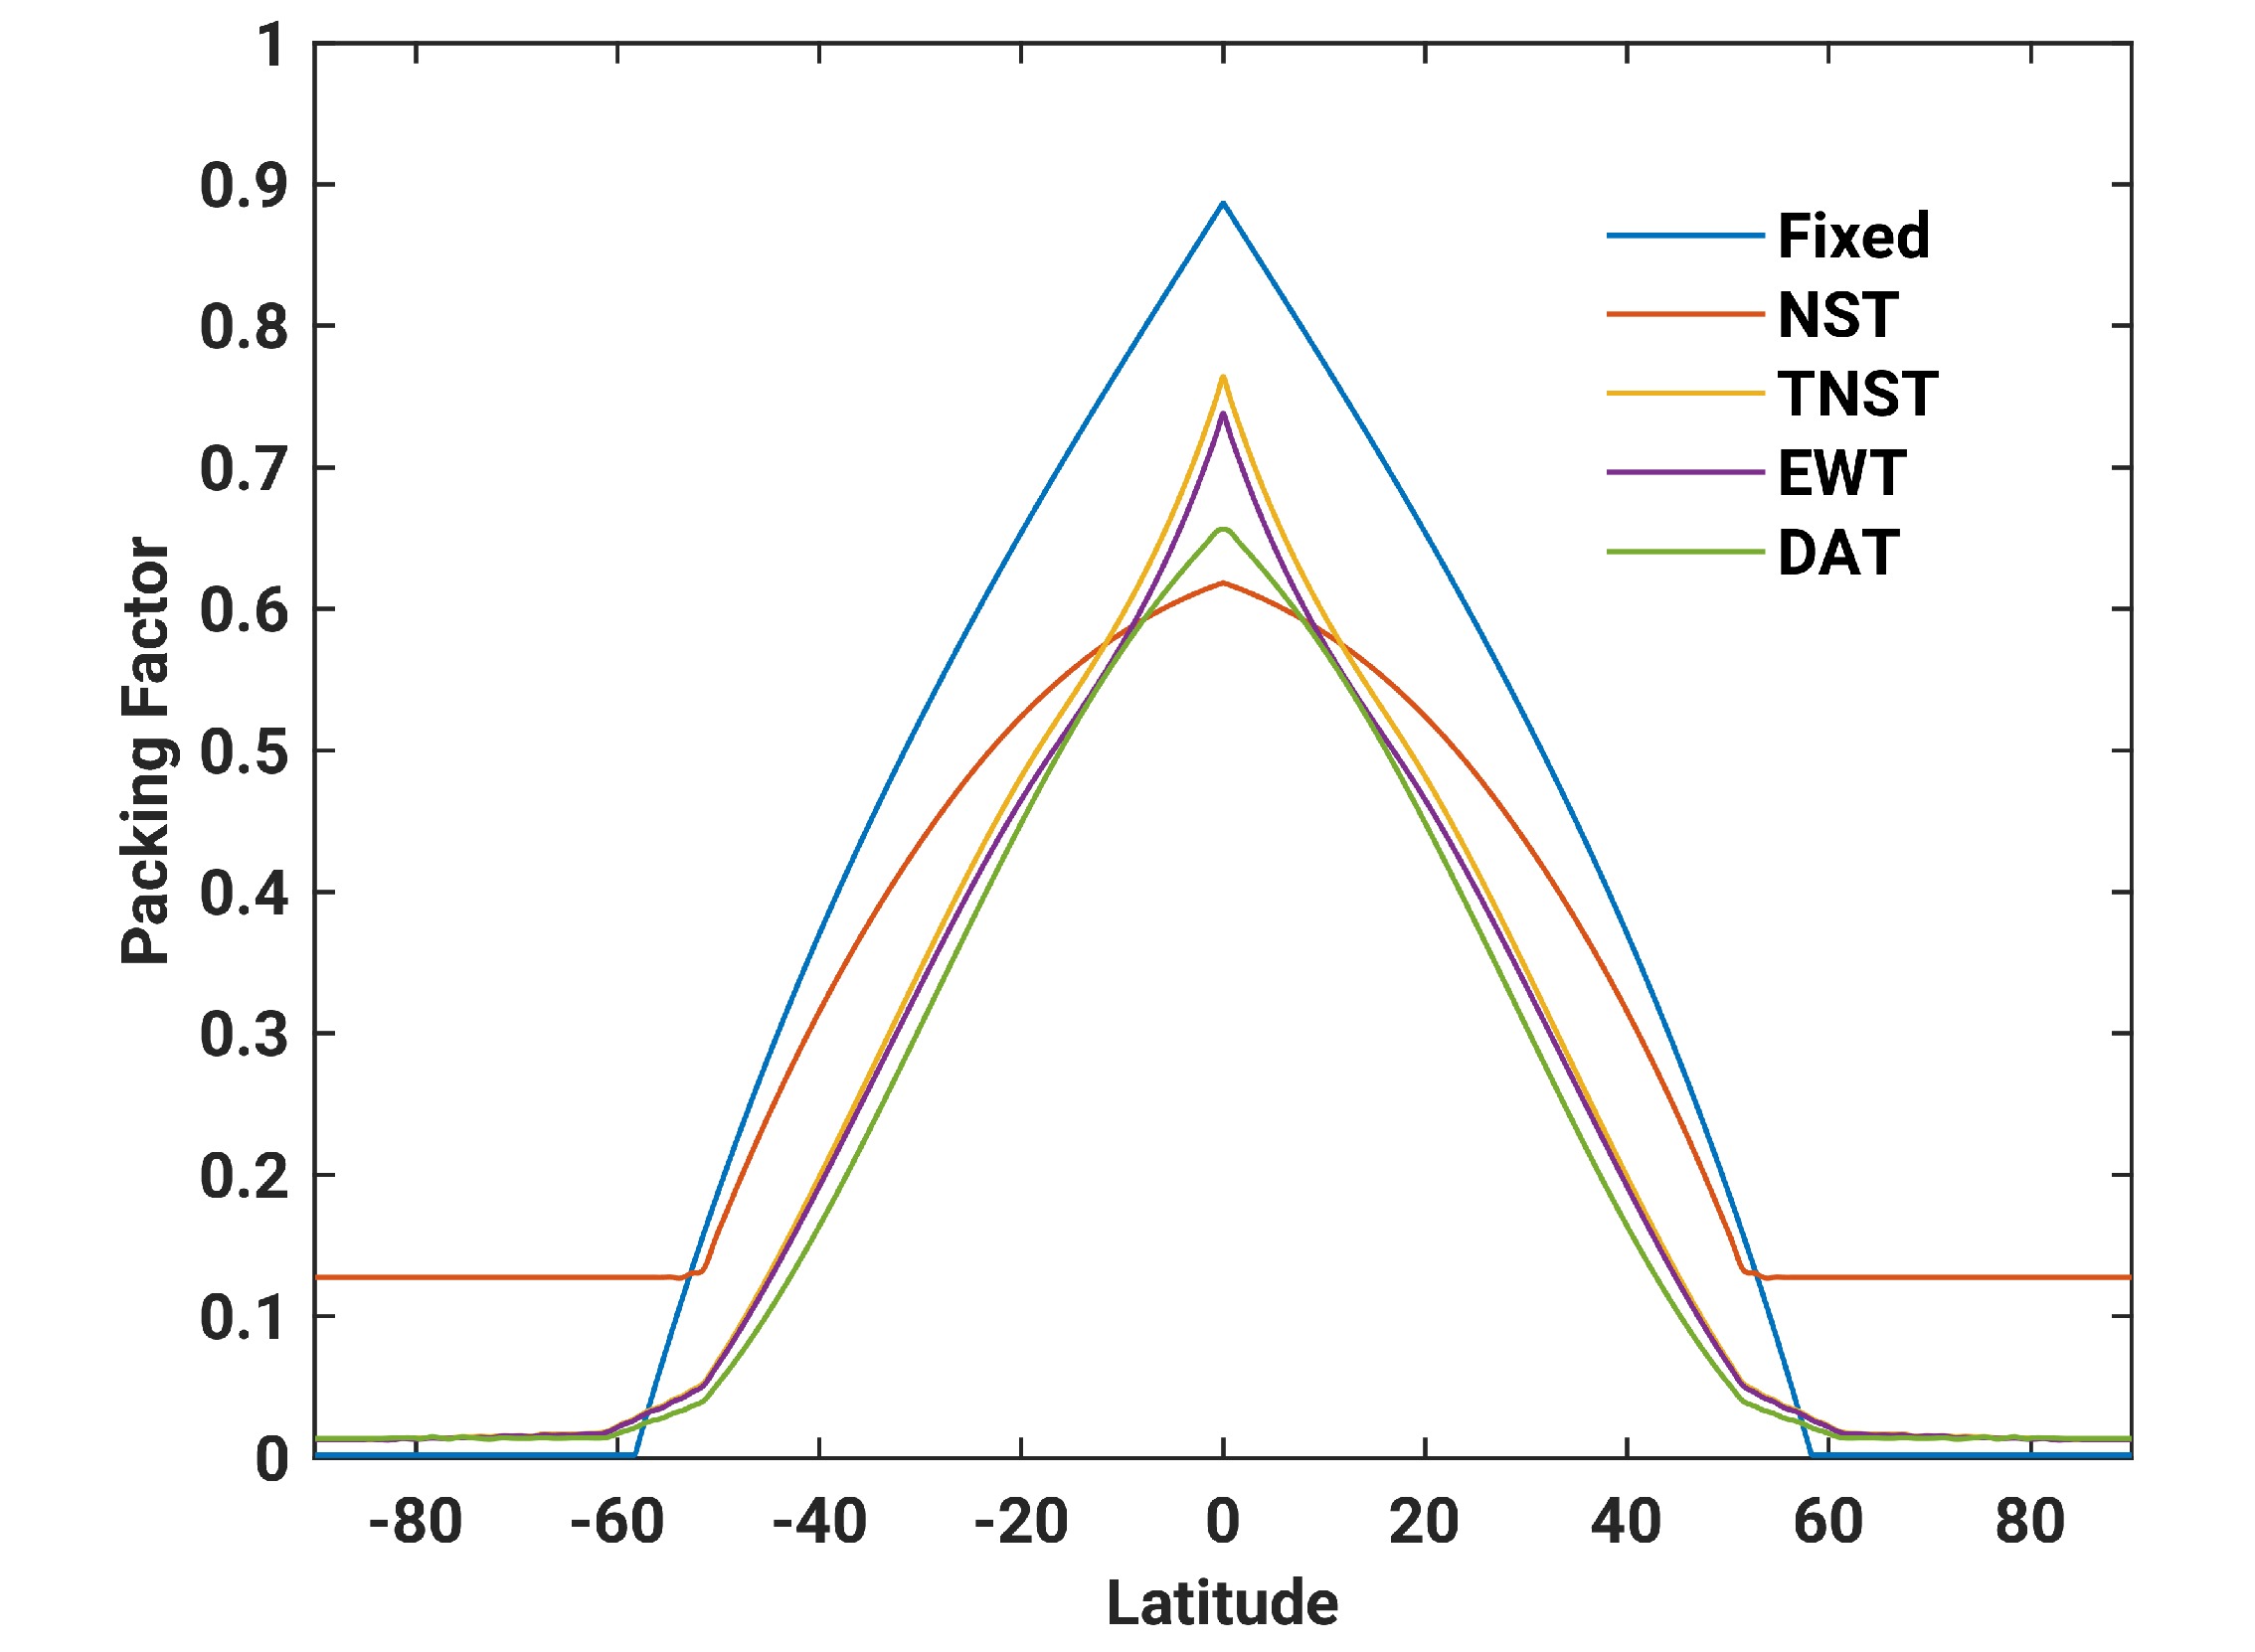
Figure 3.
Packing factor of different solar PV mounts with latitude.
-
Figure 4.
Spatial distribution of multi-year average
-
Figure 5.
Spatial distribution of multi-year average
-
Figure 6.
The optimal layouts of different solar mounts based on maximum electricity generation.
-
Figure 7.
Lorenz curve of solar electricity generation potential versus electricity demand. The x-axis and y-axis are normalized cumulative electricity demand and generation potential by each country, respectively. Each black dot represents a country.
-
Figure 8.
The lowest threshold requirement of solar energy development in the scenario that only PV is used to meet the national electricity demand.
