
DeepSAT4D: Deep learning empowers four-dimensional atmospheric chemical concentration and emission retrieval from satellite
-
GRAPHICAL ABSTRACT
 DownLoad:
Full size image
DownLoad:
Full size image
-
PUBLIC SUMMARY
-
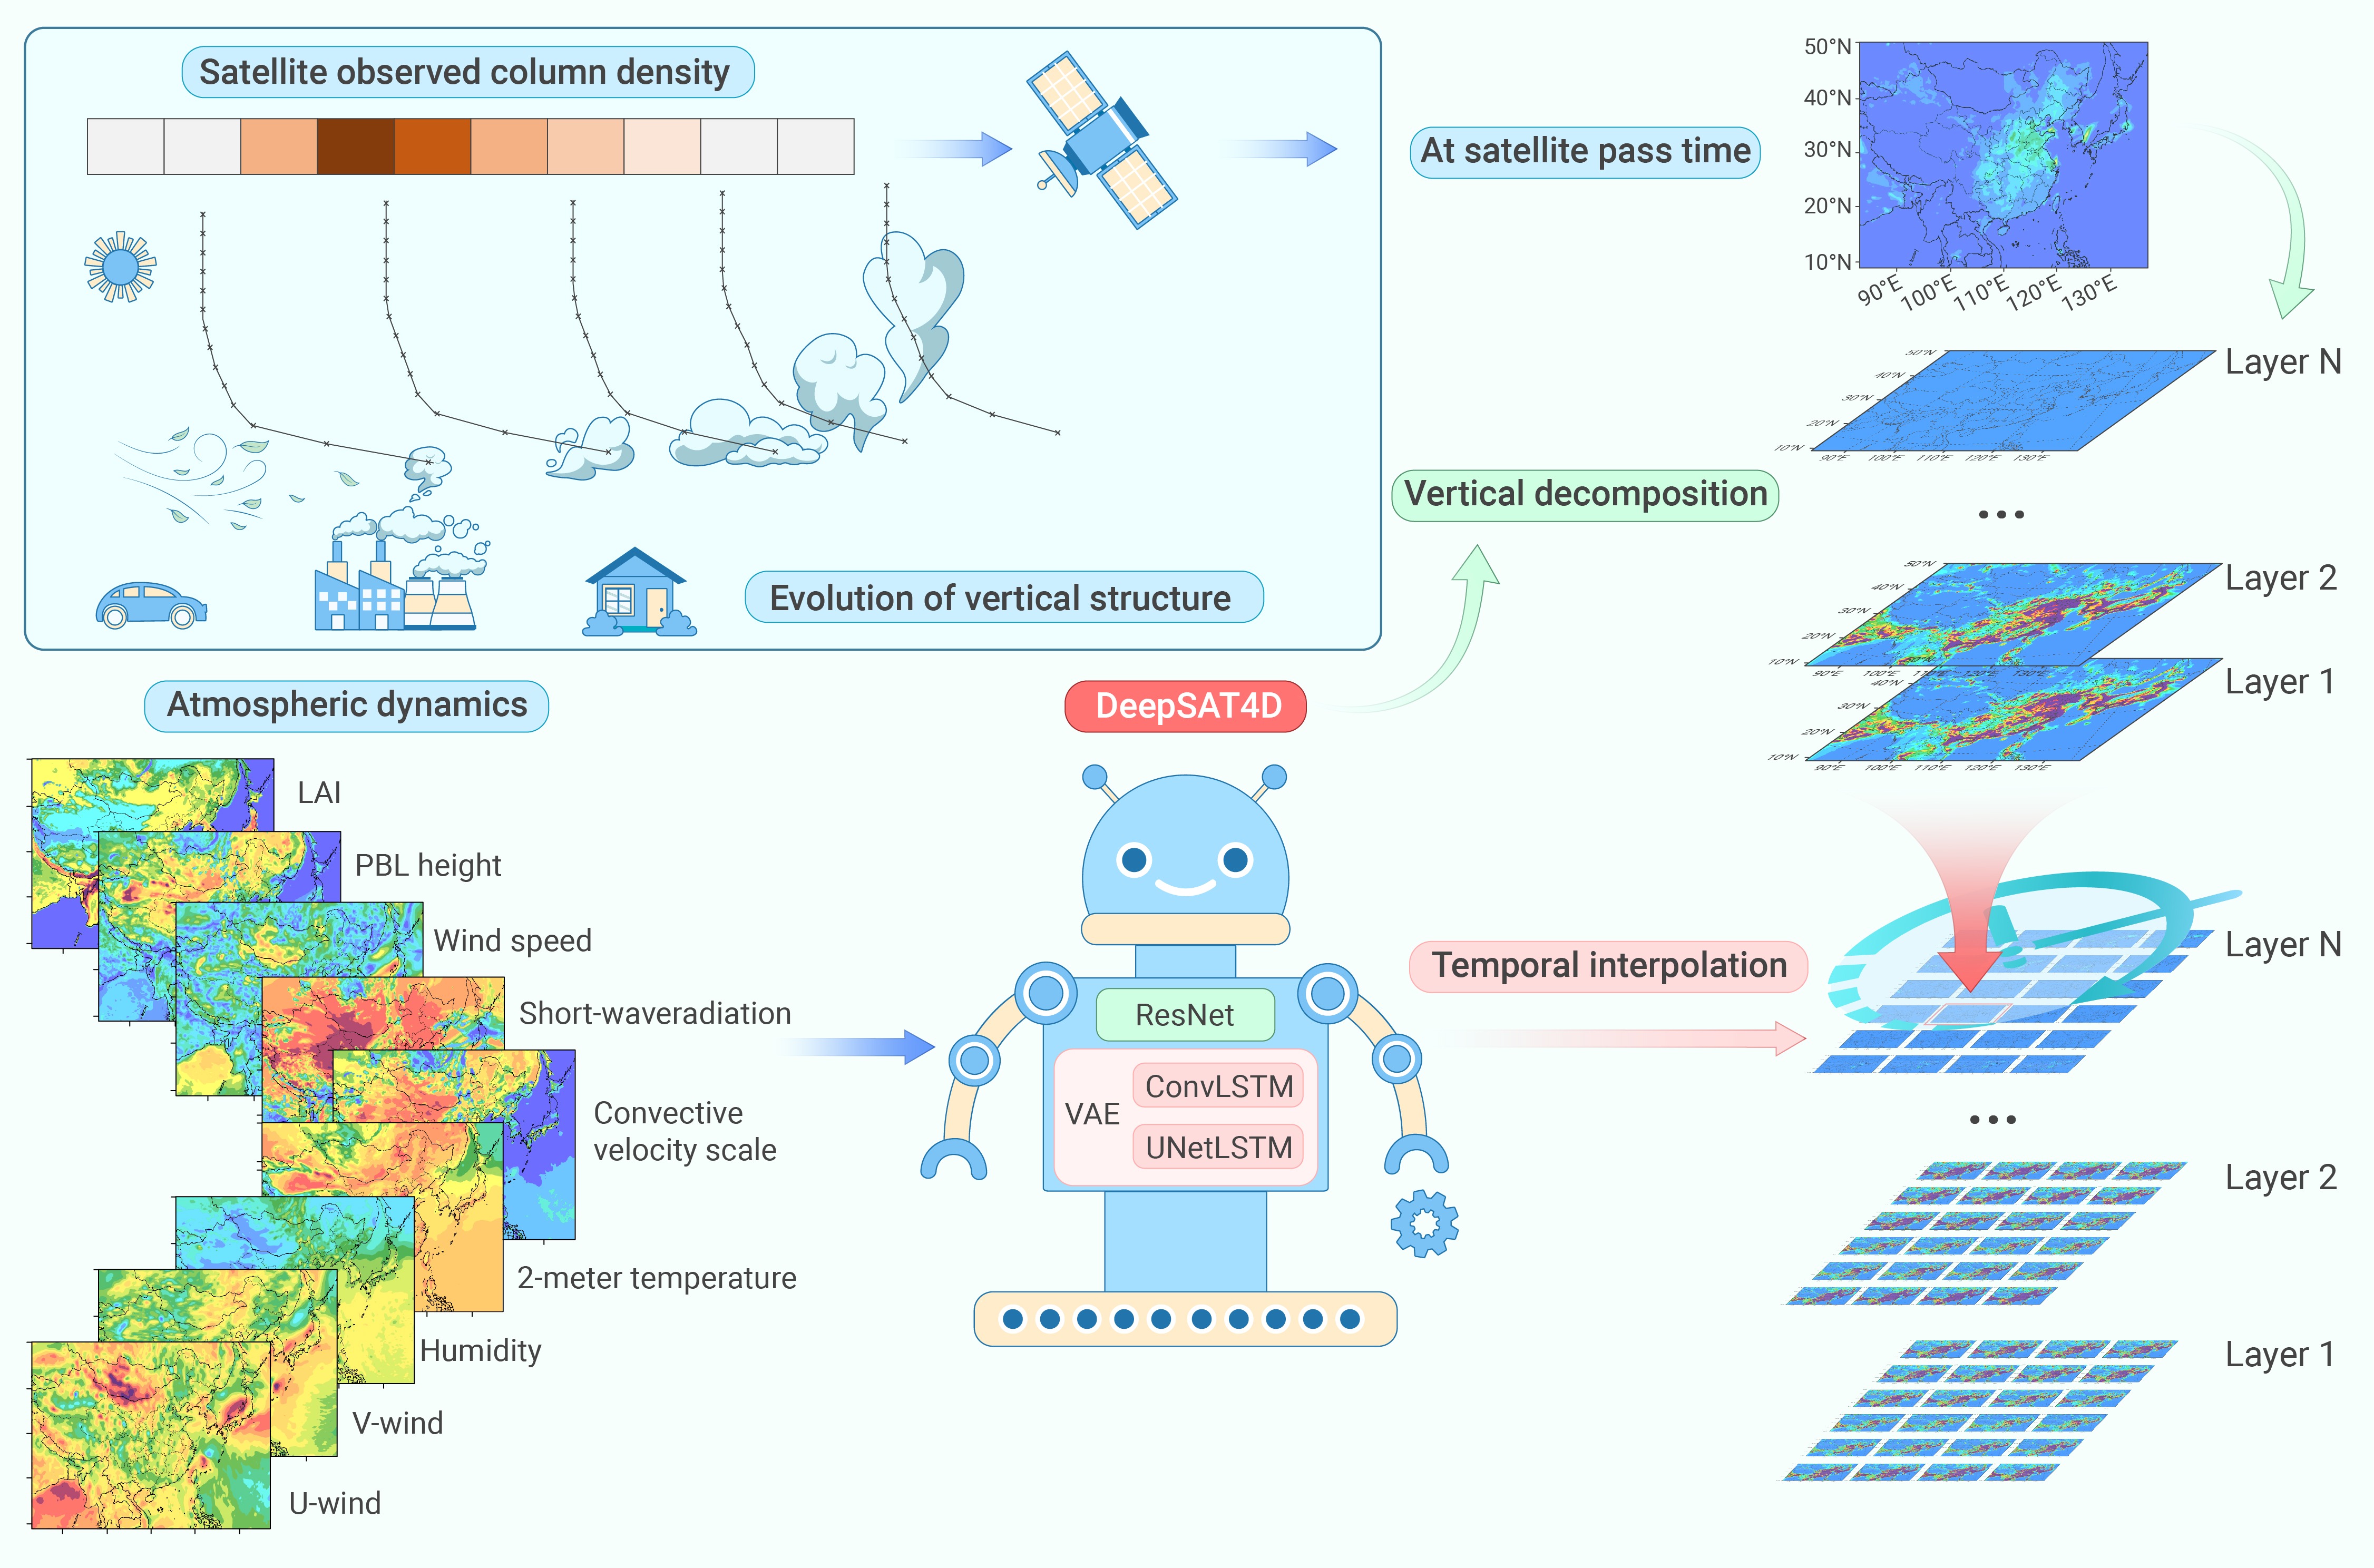
A deep learning model (DeepSAT4D) is developed to retrieve 4D chemical concentrations from satellite.
The DeepSAT4D can regenerate dynamic evolution of vertical structure of atmospheric chemicals.
The DeepSAT4D was applied to retrieve 2017-2021 4D NO2 concentrations and NOx emissions in China.
-
-
ABSTRACT
Accurate measurement of atmospheric chemicals is essential for understanding their impact on human health, climate, and ecosystems. Satellites provide a unique advantage by capturing data across the entire atmosphere, but their measurements often lack vertical details. Here, we introduce DeepSAT4D, an innovative method that efficiently reconstructs 4D chemical concentrations from satellite data. It achieves this by regenerating the dynamic evolution of vertical structure, intricately linked to complex atmospheric processes such as plume rise and transport, using advanced deep learning techniques. Its application with the Ozone Monitoring Instrument - Nitrogen Dioxide, a commonly used satellite product, demonstrates good agreement with ground-based monitoring sites in China from 2017 to 2021. Additionally, DeepSAT4D successfully captures emission reductions during 2020-pandemic shutdown. These findings emphasize DeepSAT4D’s potential to enhance our understanding of the complete atmospheric chemical composition and to provide improved assessments of its impact on human health and Earth’s ecosystem in the future.-
Keywords:
- satellite retrievals /
- machine learning /
- atmospheric chemical /
- emission /
- air pollution
-

-
REFERENCES
[1] Lerdau, M. T., Munger, J. W., and Jacob, D. J. (2000). The NO2 flux conundrum. Science 289(5488): 2291−2293. DOI: 10.1126/science.289.5488.2291. [2] Xue, T., Tong, M., Wang, M., et al. (2023). Health impacts of long-term NO2 exposure and inequalities among the Chinese population from 2013 to 2020. Environmental Science & Technology 57 (13):5349-5357. DOI: 10.1021/acs.est.2c08022. [3] Dong, Z., Wang, S., Jiang, Y., et al. (2023). An acid rain–friendly NH3 control strategy to maximize benefits toward human health and nitrogen deposition. Science of The Total Environment 859: 160116. DOI: 10.1016/j.scitotenv.2022.160116. [4] Callies, J., Corpaccioli, E., Eisinger, M., et al. (2000). GOME-2-Metop’s second-generation sensor for operational ozone monitoring. ESA bulletin 102: 28−36. https://www.esa.int/esapub/bulletin/bullet102/Callies102.pdf [5] Bovensmann, H., Burrows, J. P., Buchwitz, M., et al. (1999). SCIAMACHY: Mission objectives and measurement modes. Journal of the atmospheric sciences 56(2): 127−150. DOI: 2.0.CO;2">10.1175/1520-0469(1999)056<0127:SMOAMM>2.0.CO;2. [6] Celarier, E. A., Brinksma, E. J., Gleason, J. F., et al. (2008). Validation of Ozone Monitoring Instrument nitrogen dioxide columns. Journal of Geophysical Research: Atmospheres 113(D15): 1−2. DOI: 10.1029/2007JD008908. [7] Waters, J. W., Froidevaux, L., Harwood, R. S., et al. (2006). The earth observing system microwave limb sounder (EOS MLS) on the Aura satellite. IEEE transactions on geoscience and remote sensing 44(5): 1075−1092. DOI: 10.1109/TGRS.2006.873771. [8] Achakulwisut, P., Brauer, M., Hystad, P., et al. (2019). Global, national, and urban burdens of paediatric asthma incidence attributable to ambient NO2 pollution: Estimates from global datasets. The Lancet Planetary Health 3(4): e166−e178. DOI: 10.1016/S2542-5196(19)30046-4. [9] Geddes, J. A., Martin, R. V., Boys, B. L., et al. (2016). Long-term trends worldwide in ambient NO2 concentrations inferred from satellite observations. Environmental health perspectives 124(3): 281−289. DOI: 10.1289/ehp.1409567. [10] Anand, J. S., and Monks, P. S. (2017). Estimating daily surface NO2 concentrations from satellite data–a case study over Hong Kong using land use regression models. Atmospheric Chemistry and Physics 17(13): 8211−8230. DOI: 10.5194/acp-17-8211-2017. [11] Chi, Y., Fan, M., Zhao, C., et al. (2021). Ground-level NO2 concentration estimation based on OMI tropospheric NO2 and its spatiotemporal characteristics in typical regions of China. Atmospheric Research 264: 105821. DOI: 10.1016/j.atmosres.2021.105821. [12] Yu, M., and Liu, Q. (2021). Deep learning-based downscaling of tropospheric nitrogen dioxide using ground-level and satellite observations. Science of the Total Environment 773: 145145. DOI: 10.1016/j.scitotenv.2021.145145. [13] Ghahremanloo, M., Lops, Y., Choi, Y., et al. (2021). Deep learning estimation of daily ground‐level NO2 concentrations from remote sensing data. Journal of Geophysical Research: Atmospheres 126(21): e2021JD034925. DOI: 10.1029/2021JD034925. [14] Wei, J., Liu, S., Li, Z., et al. (2022). Ground-level NO2 surveillance from space across China for high resolution using interpretable spatiotemporally weighted artificial intelligence. Environmental Science & Technology 56(14): 9988−9998. DOI: 10.1021/acs.est.2c03834. [15] Long, S., Wei, X., Zhang, F., et al. (2022). Estimating daily ground-level NO2 concentrations over China based on TROPOMI observations and machine learning approach. Atmospheric Environment 289: 119310. DOI: 10.1016/j.atmosenv.2022.119310. [16] Grzybowski, P. T., Markowicz, K. M., and Musiał, J. P. (2023). Estimations of the ground-level NO2 concentrations based on the Sentinel-5P NO2 tropospheric column number density product. Remote Sensing 15(2): 378. DOI: 10.3390/rs15020378. [17] Li, T., and Cheng, X. (2021). Estimating daily full-coverage surface ozone concentration using satellite observations and a spatiotemporally embedded deep learning approach. International Journal of Applied Earth Observation and Geoinformation 101: 102356. DOI: 10.1016/j.jag.2021.102356. [18] Wang, Y., Yuan, Q., Li, T., et al. (2021). Estimating daily full-coverage near surface O3, CO, and NO2 concentrations at a high spatial resolution over China based on S5P-TROPOMI and GEOS-FP. ISPRS Journal of Photogrammetry and Remote Sensing 175: 311−325. DOI: 10.1016/j.isprsjprs.2021.03.018. [19] Zhu, S., Xu, J., Fan, M., et al. (2023). Estimating near-surface concentrations of major air pollutants from space: A universal estimation framework LAPSO. IEEE Transactions on Geoscience and Remote Sensing 61: 1−11. DOI: 10.1109/TGRS.2023.3248180. [20] Zhu, S., Xu, J., Zeng, J., et al. (2023). LESO: A ten-year ensemble of satellite-derived intercontinental hourly surface ozone concentrations. Scientific Data 10(1): 741. DOI: 10.1038/s41597-023-02656-4. [21] Lamsal, L.N., Martin, R.V., Van Donkelaar, A., et al. (2008). Ground‐level nitrogen dioxide concentrations inferred from the satellite‐borne Ozone Monitoring Instrument. Journal of Geophysical Research: Atmospheres, 113 (D16):15. DOI: 10.1029/2007jd009235. [22] Bechle, M. J., Millet, D. B., and Marshall, J. D. (2013). Remote sensing of exposure to NO2: Satellite versus ground-based measurement in a large urban area. Atmospheric Environment 69: 345−353. DOI: 10.1016/j.atmosenv.2012.11.046. [23] Lin, J.-T., Martin, R. V., Boersma, K. F., et al. (2014). Retrieving tropospheric nitrogen dioxide from the Ozone Monitoring Instrument: Effects of aerosols, surface reflectance anisotropy, and vertical profile of nitrogen dioxide. Atmos. Chem. Phys., 14 (3):1441–1461. DOI: 10.5194/acp-14-1441-2014. [24] Lin, J. T., and McElroy, M. B. (2010). Impacts of boundary layer mixing on pollutant vertical profiles in the lower troposphere: Implications to satellite remote sensing. Atmospheric Environment 44(14): 1726−1739. DOI: 10.1016/j.atmosenv.2010.02.009. [25] Wang, Y., Dörner, S., Donner, S. , et al. (2019). Vertical profiles of NO2, SO2, HONO, HCHO, CHOCHO and aerosols derived from MAX-DOAS measurements at a rural site in the central western North China Plain and their relation to emission sources and effects of regional transport. Atmospheric Chemistry and Physics 19(8): 5417−5449. DOI: 10.5194/acp-19-5417-2019. [26] Kong, L., Tang, X., Zhu, J., et al. (2021). A 6-year-long (2013–2018) high-resolution air quality reanalysis dataset in China based on the assimilation of surface observations from CNEMC. Earth System Science Data 13(2): 529−570. DOI: 10.5194/essd-13-529-2021. [27] Houyoux, M. R., and Vukovich, J. M. (1999). Updates to the Sparse Matrix Operator Kernel Emissions (SMOKE) modeling system and integration with Models-3. The Emission Inventory: Regional Strategies for the Future 1461: 1−11. [28] Han, K. M., Lee, S., Chang, L. S., et al. (2015). A comparison study between CMAQ-simulated and OMI-retrieved NO2 columns over East Asia for evaluation of NOx emission fluxes of INTEX-B, CAPSS, and REAS inventories. Atmospheric Chemistry and Physics 15(4): 1913−1938. DOI: 10.5194/acp-15-1913-2015. [29] Kuhlmann, G., Lam, Y. F., Cheung, H. M., et al. (2015). Development of a custom OMI NO2 data product for evaluating biases in a regional chemistry transport model. Atmospheric Chemistry and Physics 15(10): 5627−5644. DOI: 10.5194/acp-15-5627-2015. [30] Liu, L., Zhang, X., Xu, W., et al. (2020). Reviewing global estimates of surface reactive nitrogen concentration and deposition using satellite retrievals. Atmospheric Chemistry and Physics 20(14): 8641−8658. DOI: 10.5194/acp-20-8641-2020. [31] Huang, L., Liu, S., Yang, Z., et al. (2021). Exploring deep learning for air pollutant emission estimation. Geoscientific Model Development 14(7): 4641−4654. DOI: 10.5194/gmd-14-4641-2021. [32] Xing, J., Li, S., Zheng, S., et al. (2022). Rapid Inference of Nitrogen Oxide Emissions Based on a Top-Down Method with a Physically Informed Variational Autoencoder. Environmental Science & Technology 56(14): 9903−9914. DOI: 10.1021/acs.est.1c08337. [33] Xing, J., Zheng, S., Ding, D., et al. (2020). Deep learning for prediction of the air quality response to emission changes. Environmental science & technology 54(14): 8589−8600. DOI: 10.1021/acs.est.0c02923. [34] Xing, J., Zheng, S., Li, S., et al. (2022). Mimicking atmospheric photochemical modeling with a deep neural network. Atmospheric research 265: 105919. DOI: 10.1016/j.atmosres.2021.105919. [35] He, K., Zhang, X., Ren, S., et al. (2016). Deep residual learning for image recognition. In Proceedings of the IEEE conference on computer vision and pattern recognition (pp. 770-778). DOI: 10.1109/CVPR.2016.90. [36] Kingma, D. P., and Welling, M. (2013). Auto-encoding variational bayes. arXiv preprint arXiv:1312.6114. DOI: 10.48550/arXiv.1312.6114 [37] Shi, X., Chen, Z., Wang, H., et al. (2015). Convolutional LSTM network: A machine learning approach for precipitation nowcasting. Advances in neural information processing systems 28 . DOI: 10.1007/978-3-319-21233-3_6. [38] Appel, K., Pouliot, G., Simon, H., et al. (2013). Evaluation of dust and trace metal estimates from the Community Multiscale Air Quality (CMAQ) model version 5.0. Geoscientific Model Development 6 (4):883-899. DOI: 10.5194/gmd-6-883-2013. [39] Skamarock, W. C., Klemp, J. B., Dudhia, J., et al. (2008). A Description of the Advanced Research WRF Version 3. NCAR Tech. Note NCAR/TN-475+STR 113. DOI: 10.13140/RG.2.1.2310.6645. [40] Deng, Y., Li, J., Li, Y., et al. (2019). Characteristics of volatile organic compounds, NO2, and effects on ozone formation at a site with high ozone level in Chengdu. Journal of Environmental Sciences 75: 334−345. DOI: 10.1016/j.jes.2018.05.004. [41] Kang, Y., Tang, G., Li, Q., et al. (2021). Evaluation and evolution of MAX-DOAS-observed vertical NO2 profiles in urban Beijing. Advances in Atmospheric Sciences, 38(7): 1188−1196. DOI: 10.1007/s00376-021-0370-1. [42] Liu, S., Cheng, S., Ma, J., et al. (2023). MAX-DOAS measurements of tropospheric NO2 and HCHO vertical profiles at the longfengshan regional background station in northeastern China. Sensors 23(6): 3269. DOI: 10.3390/s23063269. [43] Chen, L., Pang, X., Li, J., et al. (2022). Vertical profiles of O3, NO2 and PM in a major fine chemical industry park in the Yangtze River Delta of China detected by a sensor package on an unmanned aerial vehicle. Science of the Total Environment 845: 157113. DOI: 10.1016/j.scitotenv.2022.157113. [44] Tao, H., Xing, J., Zhou, H., et al. (2020). Impacts of improved modeling resolution on the simulation of meteorology, air quality, and human exposure to PM2.5, O3 in Beijing, China. Journal of Cleaner Production 243 :118574. DOI: 10.1016/j.jclepro.2019.118574. [45] Toro, C., Foley, K., Simon, H., et al. (2021). Evaluation of 15 years of modeled atmospheric oxidized nitrogen compounds across the contiguous United States. Elem Sci Anth 9(1): 00158. DOI: 10.1525/elementa.2020.00158. [46] Xing, J., Li, S., Jiang, Y., et al. (2020). Quantifying the emission changes and associated air quality impacts during the COVID-19 pandemic on the North China Plain: A response modeling study. Atmospheric Chemistry and Physics 20(22): 14347−14359. DOI: 10.5194/acp-20-14347-2020. [47] Fan, C., Li, Z., Li, Y., et al. (2021). Variability of NO2 concentrations over China and effect on air quality derived from satellite and ground-based observations. Atmospheric Chemistry and Physics 21(10): 7723−7748. DOI: 10.5194/acp-21-7723-2021. [48] Zheng, B., Zhang, Q., Geng, G., et al. (2021). Changes in China’s anthropogenic emissions and air quality during the COVID-19 pandemic in 2020. Earth System Science Data 13(6): 2895−2907. DOI: 10.5194/essd-13-2895-2021. [49] Guenther, A.B., Jiang, X., Heald, C.L., et al. (2012). The model of emissions of gases and aerosols from nature version 2.1 (MEGAN2. 1): An extended and updated framework for modeling biogenic emissions. Geosci. Model Dev. 5 (6):1471–1492. DOI: 10.5194/gmd-5-1471-2012. [50] Baek, B. H., Coats, C., Ma, S., et al. (2023). Dynamic Meteorology-induced Emissions Coupler (MetEmis) development in the Community Multiscale Air Quality (CMAQ): CMAQ-MetEmis. Geoscientific Model Development 16(16): 4659−4676. DOI: 10.5194/gmd-16-4659-2023. [51] Demerjian, K., Beauharnois, M., Ku J., et al. (2013). Developing real-time emissions estimates for enhanced air quality forecasting. EM: Air and Waste Management Associations Magazine for Environmental Managers. Air & Waste Management Association, Pittsburgh, PA 11:22-27. https://cfpub.epa.gov/si/si_public_record_report.cfm?Lab=NERL&dirEntryId=265045 [52] Wu, H., Kong, L., Tang, X., et al. (2023). Air Quality Forecasting with Inversely Updated Emissions for China. Environmental Science & Technology Letters 10(8):655-661. DOI: 10.1021/acs.estlett.3c00266. [53] Van Geffen, J., Boersma, K. F., Eskes, et al. (2020). S5P TROPOMI NO2 slant column retrieval: Method, stability, uncertainties and comparisons with OMI. Atmospheric Measurement Techniques, 13(3): 1315−1335. DOI: 10.5194/amt-13-1315-2020. [54] Park, S. S., Kim, S. W., Song, C. K., et al. (2020). Spatio-temporal variability of aerosol optical depth, total ozone and NO2 over East Asia: Strategy for the validation to the GEMS Scientific Products. Remote Sensing 12(14): 2256. DOI: 10.3390/rs12142256. [55] Liu, J., and Chen, W. (2022). First satellite-based regional hourly NO2 estimations using a space-time ensemble learning model: A case study for Beijing-Tianjin-Hebei Region, China. Science of The Total Environment 820: 153289. DOI: 10.1016/j.scitotenv.2022.153289. [56] Ri, X., Tana, G., Shi, C., et al. (2022). Cloud, atmospheric radiation and renewal energy application (CARE) version 1.0 cloud top property product from Himawari-8/AHI: Algorithm development and preliminary validation. IEEE Transactions on Geoscience and Remote Sensing 60 :1-11. DOI: 10.1109/TGRS.2022.3172228. [57] Tana, G., Ri, X., Shi, C., et al. (2023). Retrieval of cloud microphysical properties from Himawari-8/AHI infrared channels and its application in surface shortwave downward radiation estimation in the sun glint region. Remote Sensing of Environment 290: 113548. DOI: 10.1016/j.rse.2023.113548. [58] Ding, D., Xing, J., Wang, S., et al. (2019). Impacts of emissions and meteorological changes on China’s ozone pollution in the warm seasons of 2013 and 2017. Frontiers of Environmental Science & Engineering 13 :1-9. DOI: 10.1007/s11783-019-1160-1. [59] Ding, D., Xing, J., Wang, S., et al. (2019). Estimated contributions of emissions controls, meteorological factors, population growth, and changes in baseline mortality to reductions in ambient PM2.5 and PM2.5-related mortality in China, 2013–2017. Environmental health perspectives 127 (6):067009. DOI: 10.1289/EHP4157. [60] Zheng, H., Zhao, B., Wang, S., et al. (2019). Transition in source contributions of PM2. 5 exposure and associated premature mortality in China during 2005–2015. Environment international 132 :105111. DOI: 10.1016/j.envint.2019.105111. [61] Liu, S., Xing, J., Wang, S., et al. (2021). Health benefits of emission reduction under 1.5°C pathways far outweigh climate-related variations in China. Environmental Science & Technology 55 (16):10957-10966. DOI: 10.1021/acs.est.1c01583. [62] Kingma, D. P., and Ba, J. (2014). Adam: A method for stochastic optimization. arXiv preprint arXiv:1412.6980. DOI: 10.48550/arXiv.1412.6980. [63] Eskes, H. J., and Boersma, K. F. (2003). Averaging kernels for DOAS total-column satellite retrievals. Atmospheric Chemistry and Physics 3(5): 1285−1291. DOI: 10.5194/acp-3-1285-2003. -
ABOUT THIS ARTICLE
Cite this article:
Li S. and Xing J. (2024). DeepSAT4D: Deep learning empowers four-dimensional atmospheric chemical concentration and emission retrieval from satellite. The Innovation Geoscience 2(1): 100061. https://doi.org/10.59717/j.xinn-geo.2024.100061
Welcome!
To request copyright permission to republish or share portions of our works, please visit Copyright Clearance Center's (CCC) Marketplace website at marketplace.copyright.com.
Article Metrics
Relative Articles
Cited by
Export File
Citation
Li S. and Xing J. (2024). DeepSAT4D: Deep learning empowers four-dimensional atmospheric chemical concentration and emission retrieval from satellite. The Innovation Geoscience 2(1): 100061. https://doi.org/10.59717/j.xinn-geo.2024.100061

Format
Content

-
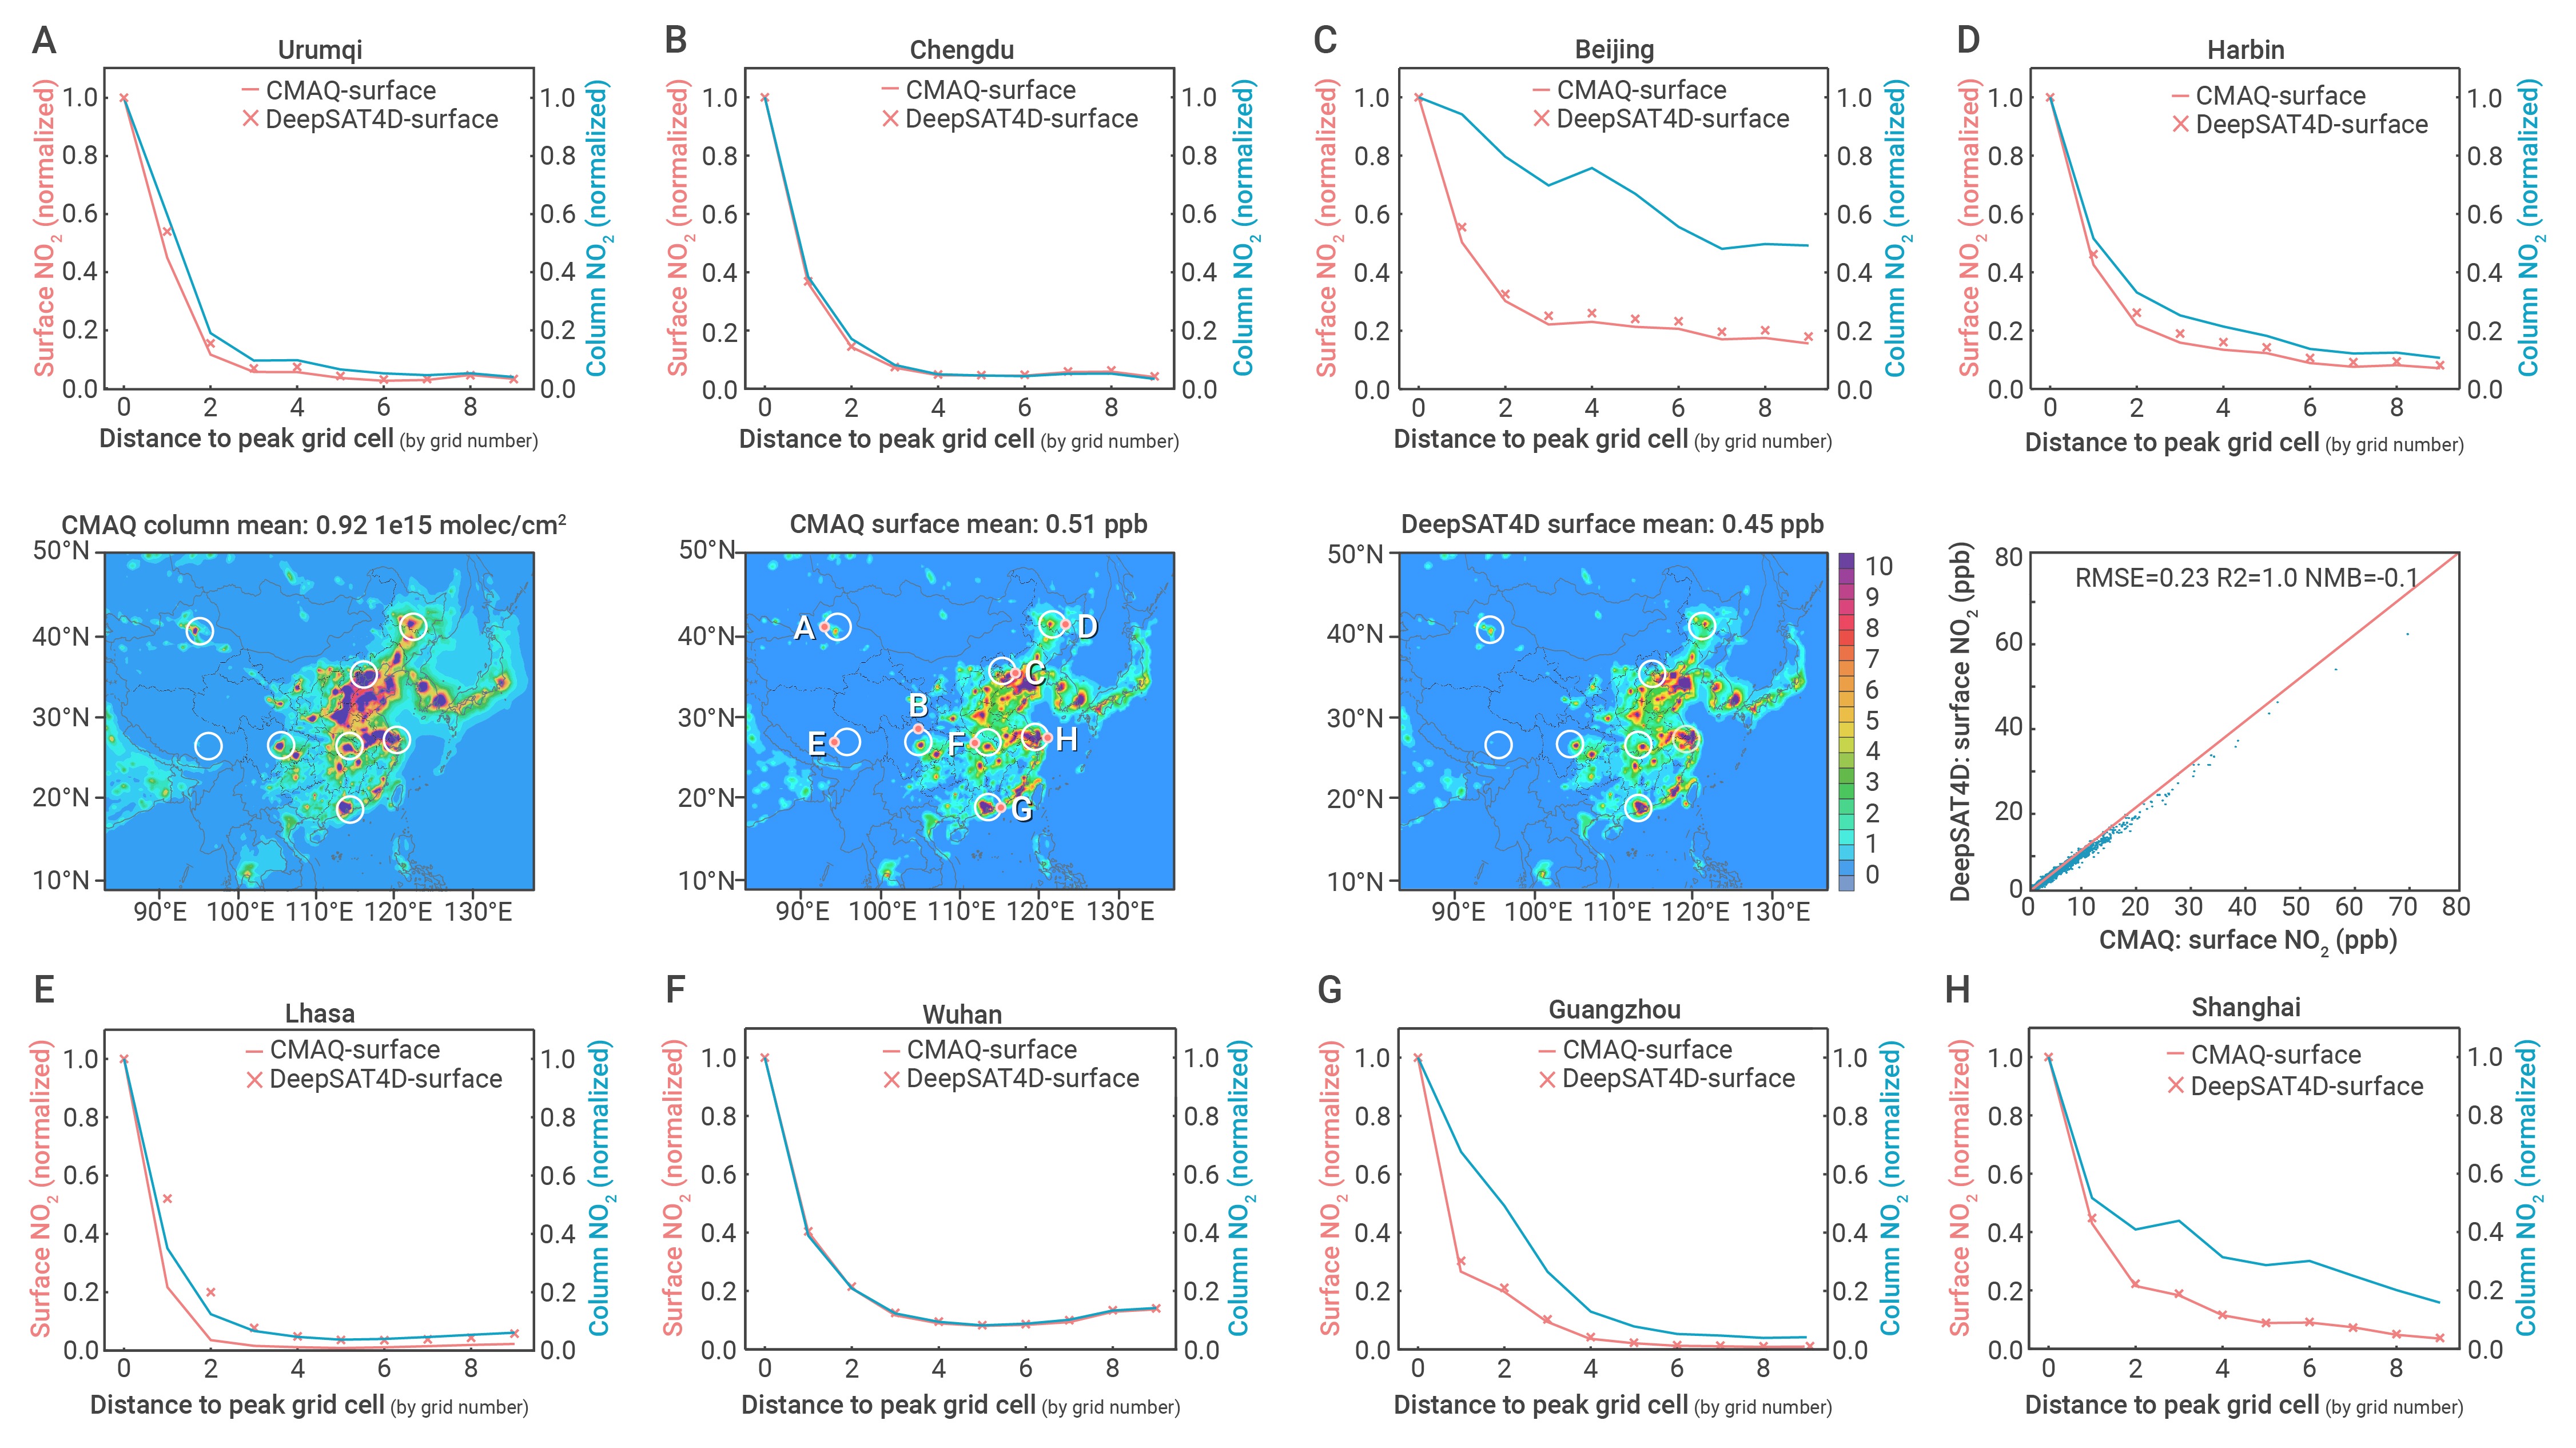
Figure 1.
Comparison of NO2 column density (CMAQ simulation, unit: 1×10 molec/cm2) and surface NO2 concentration (both simulated in CMAQ, and reproduced by DeepSAT4D, unit: ppb) across simulation domain (at 14:00 local time in 2017 baseline case) and in eight cities (selected the grid with highest surface concentration as the peak grid cell, and calculated the average concentrations in surrounding grid cells away from it by the distance up to 10 grid cells).
-
Figure 2.
OMI satellite retrieved 14:00 NO2 vertical structure profile time series during 2017-2021 (A), and seasonal 5-year averages (B), the ratio of surface to vertical mean concentration (C) and the vertical profiles in eight cities (averaging 10 grid cells surrounding the urban center) with absolute NO2 concentration (unit: ppb) (D) and normalized values (sum =1) (E) (the top height of each vertical layer is at the following altitudes: 19, 57, 114, 230, 386, 584, 910, 1375, 1908, 2618, 3598, 5061, 7620, and11944meters. These values represent the annual mean domain average).
-
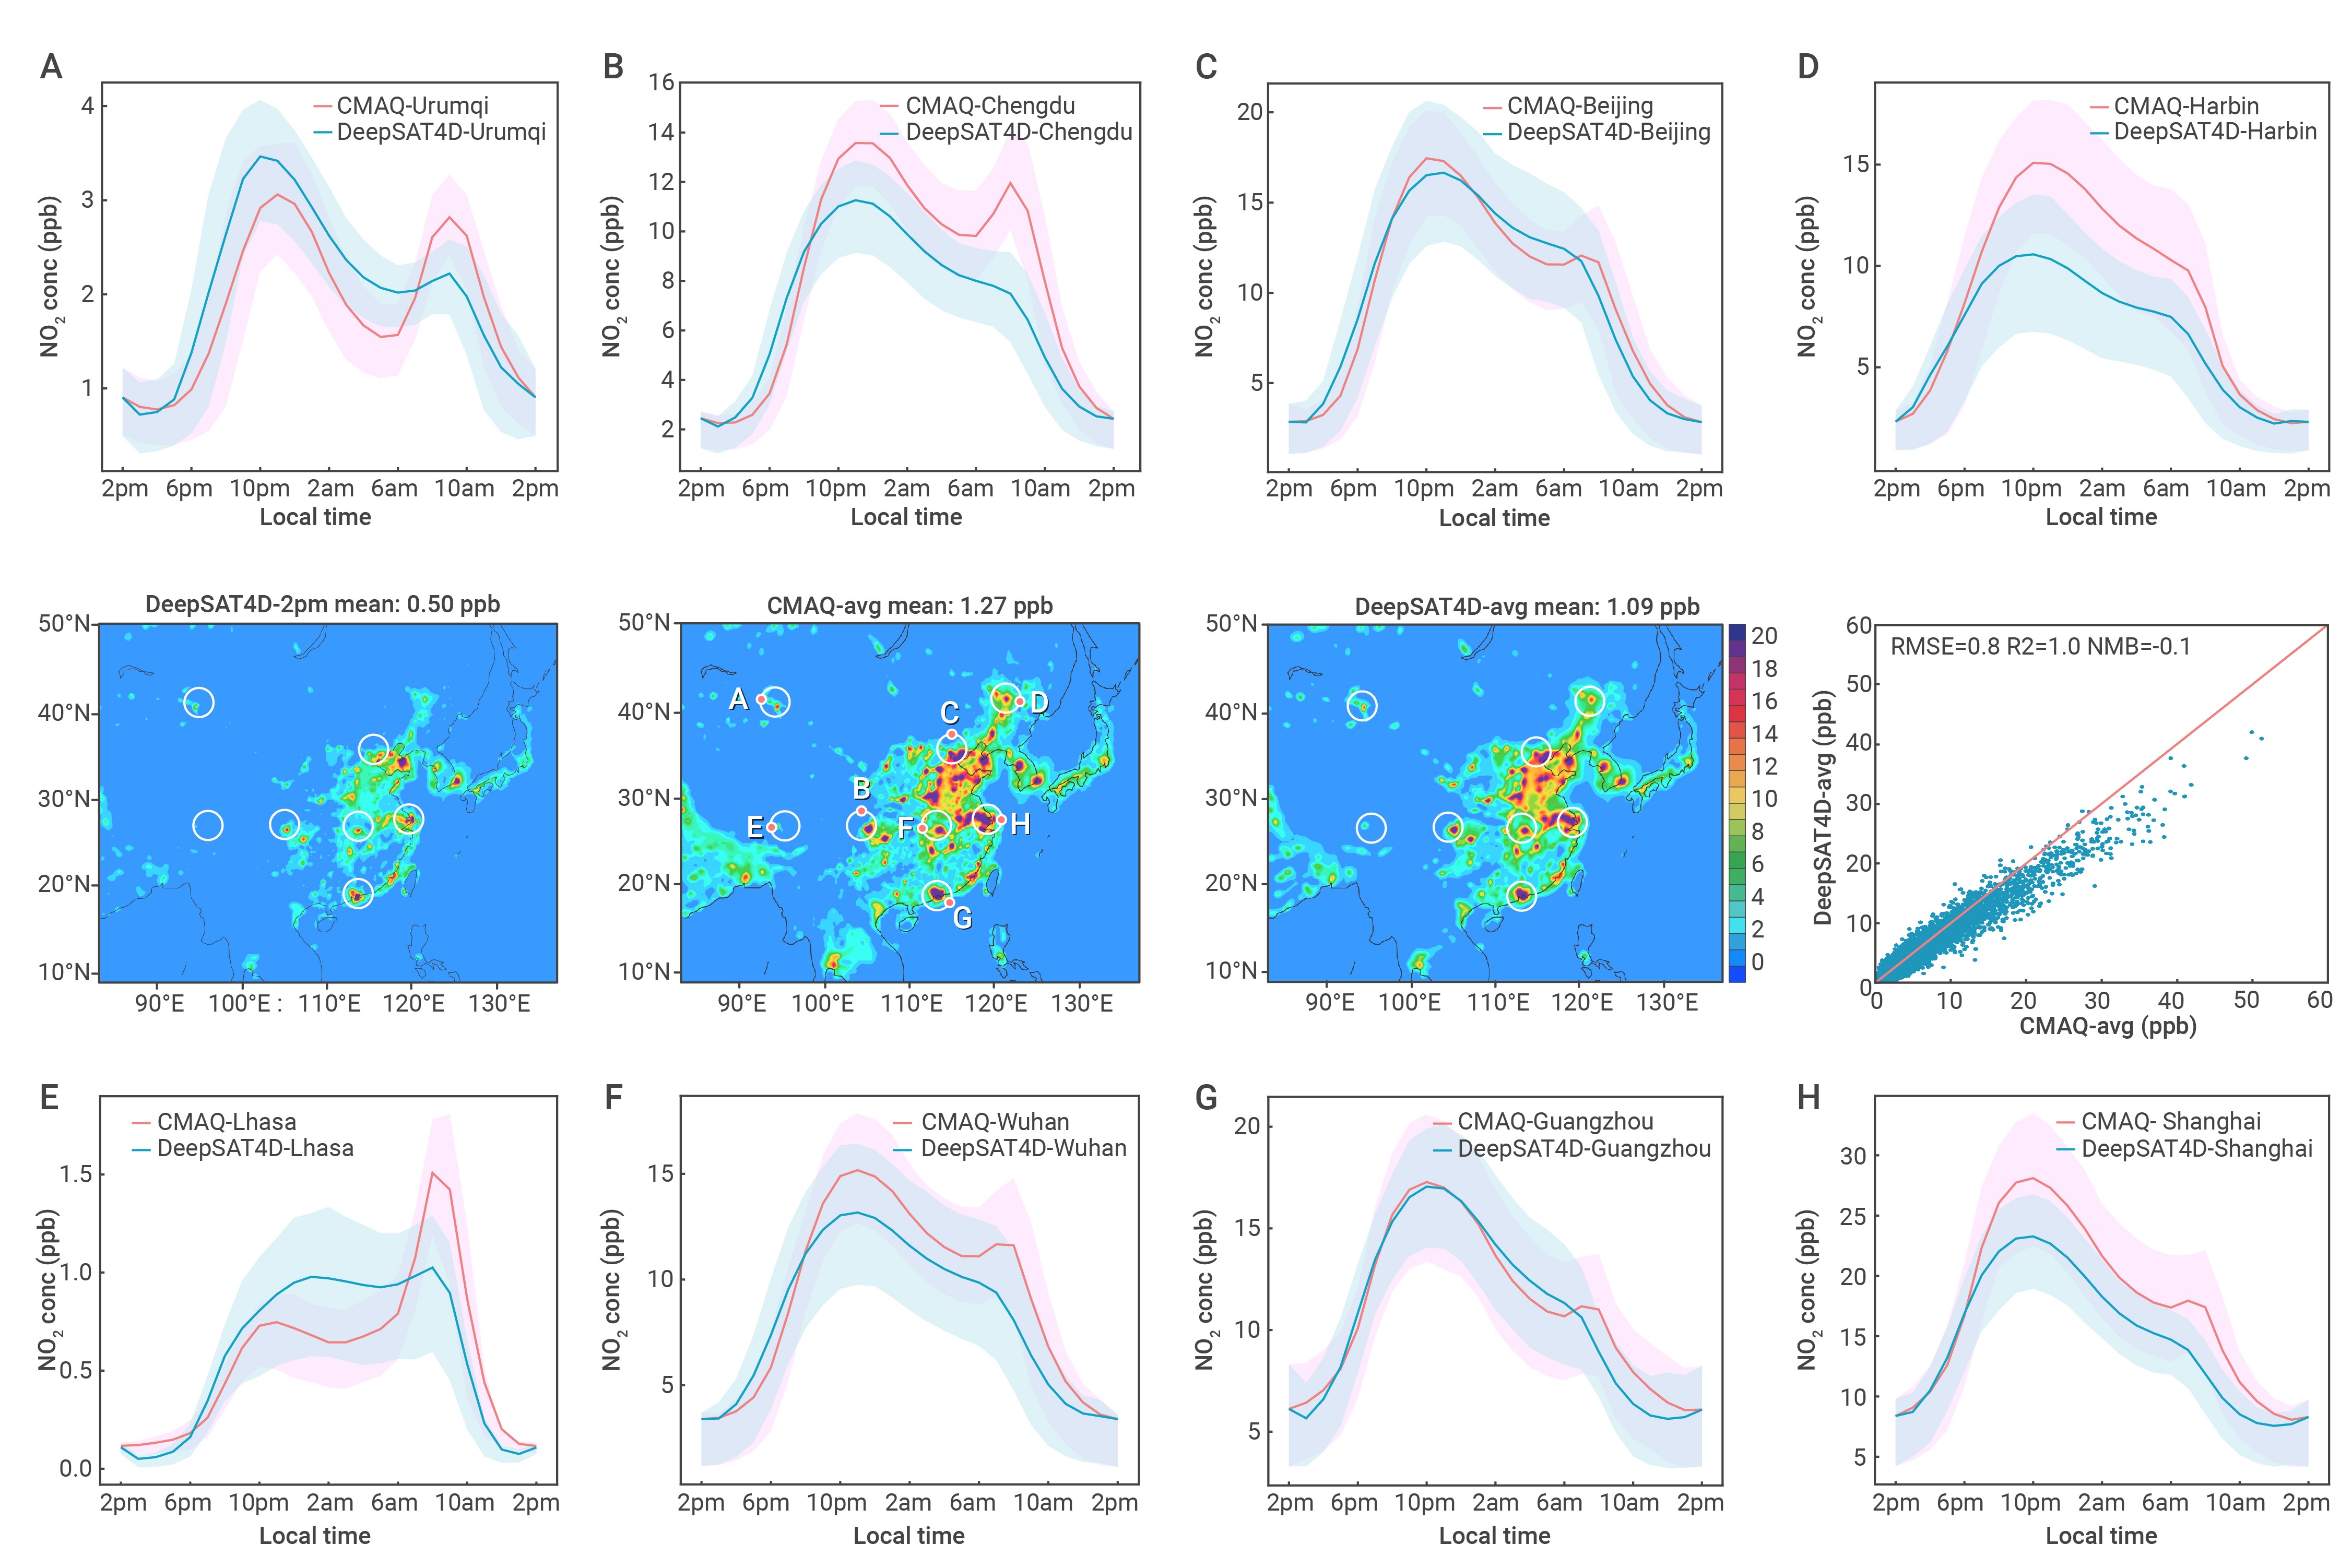
Figure 3.
Comparison of 14:00 local time surface NO2 and 24-hour averaged NO2 across simulation domain and 24-hour diurnal variation in eight cities (simulated by CMAQ and reproduced by DeepSAT4D, annual mean in 2017 baseline case, unit: ppb).
-
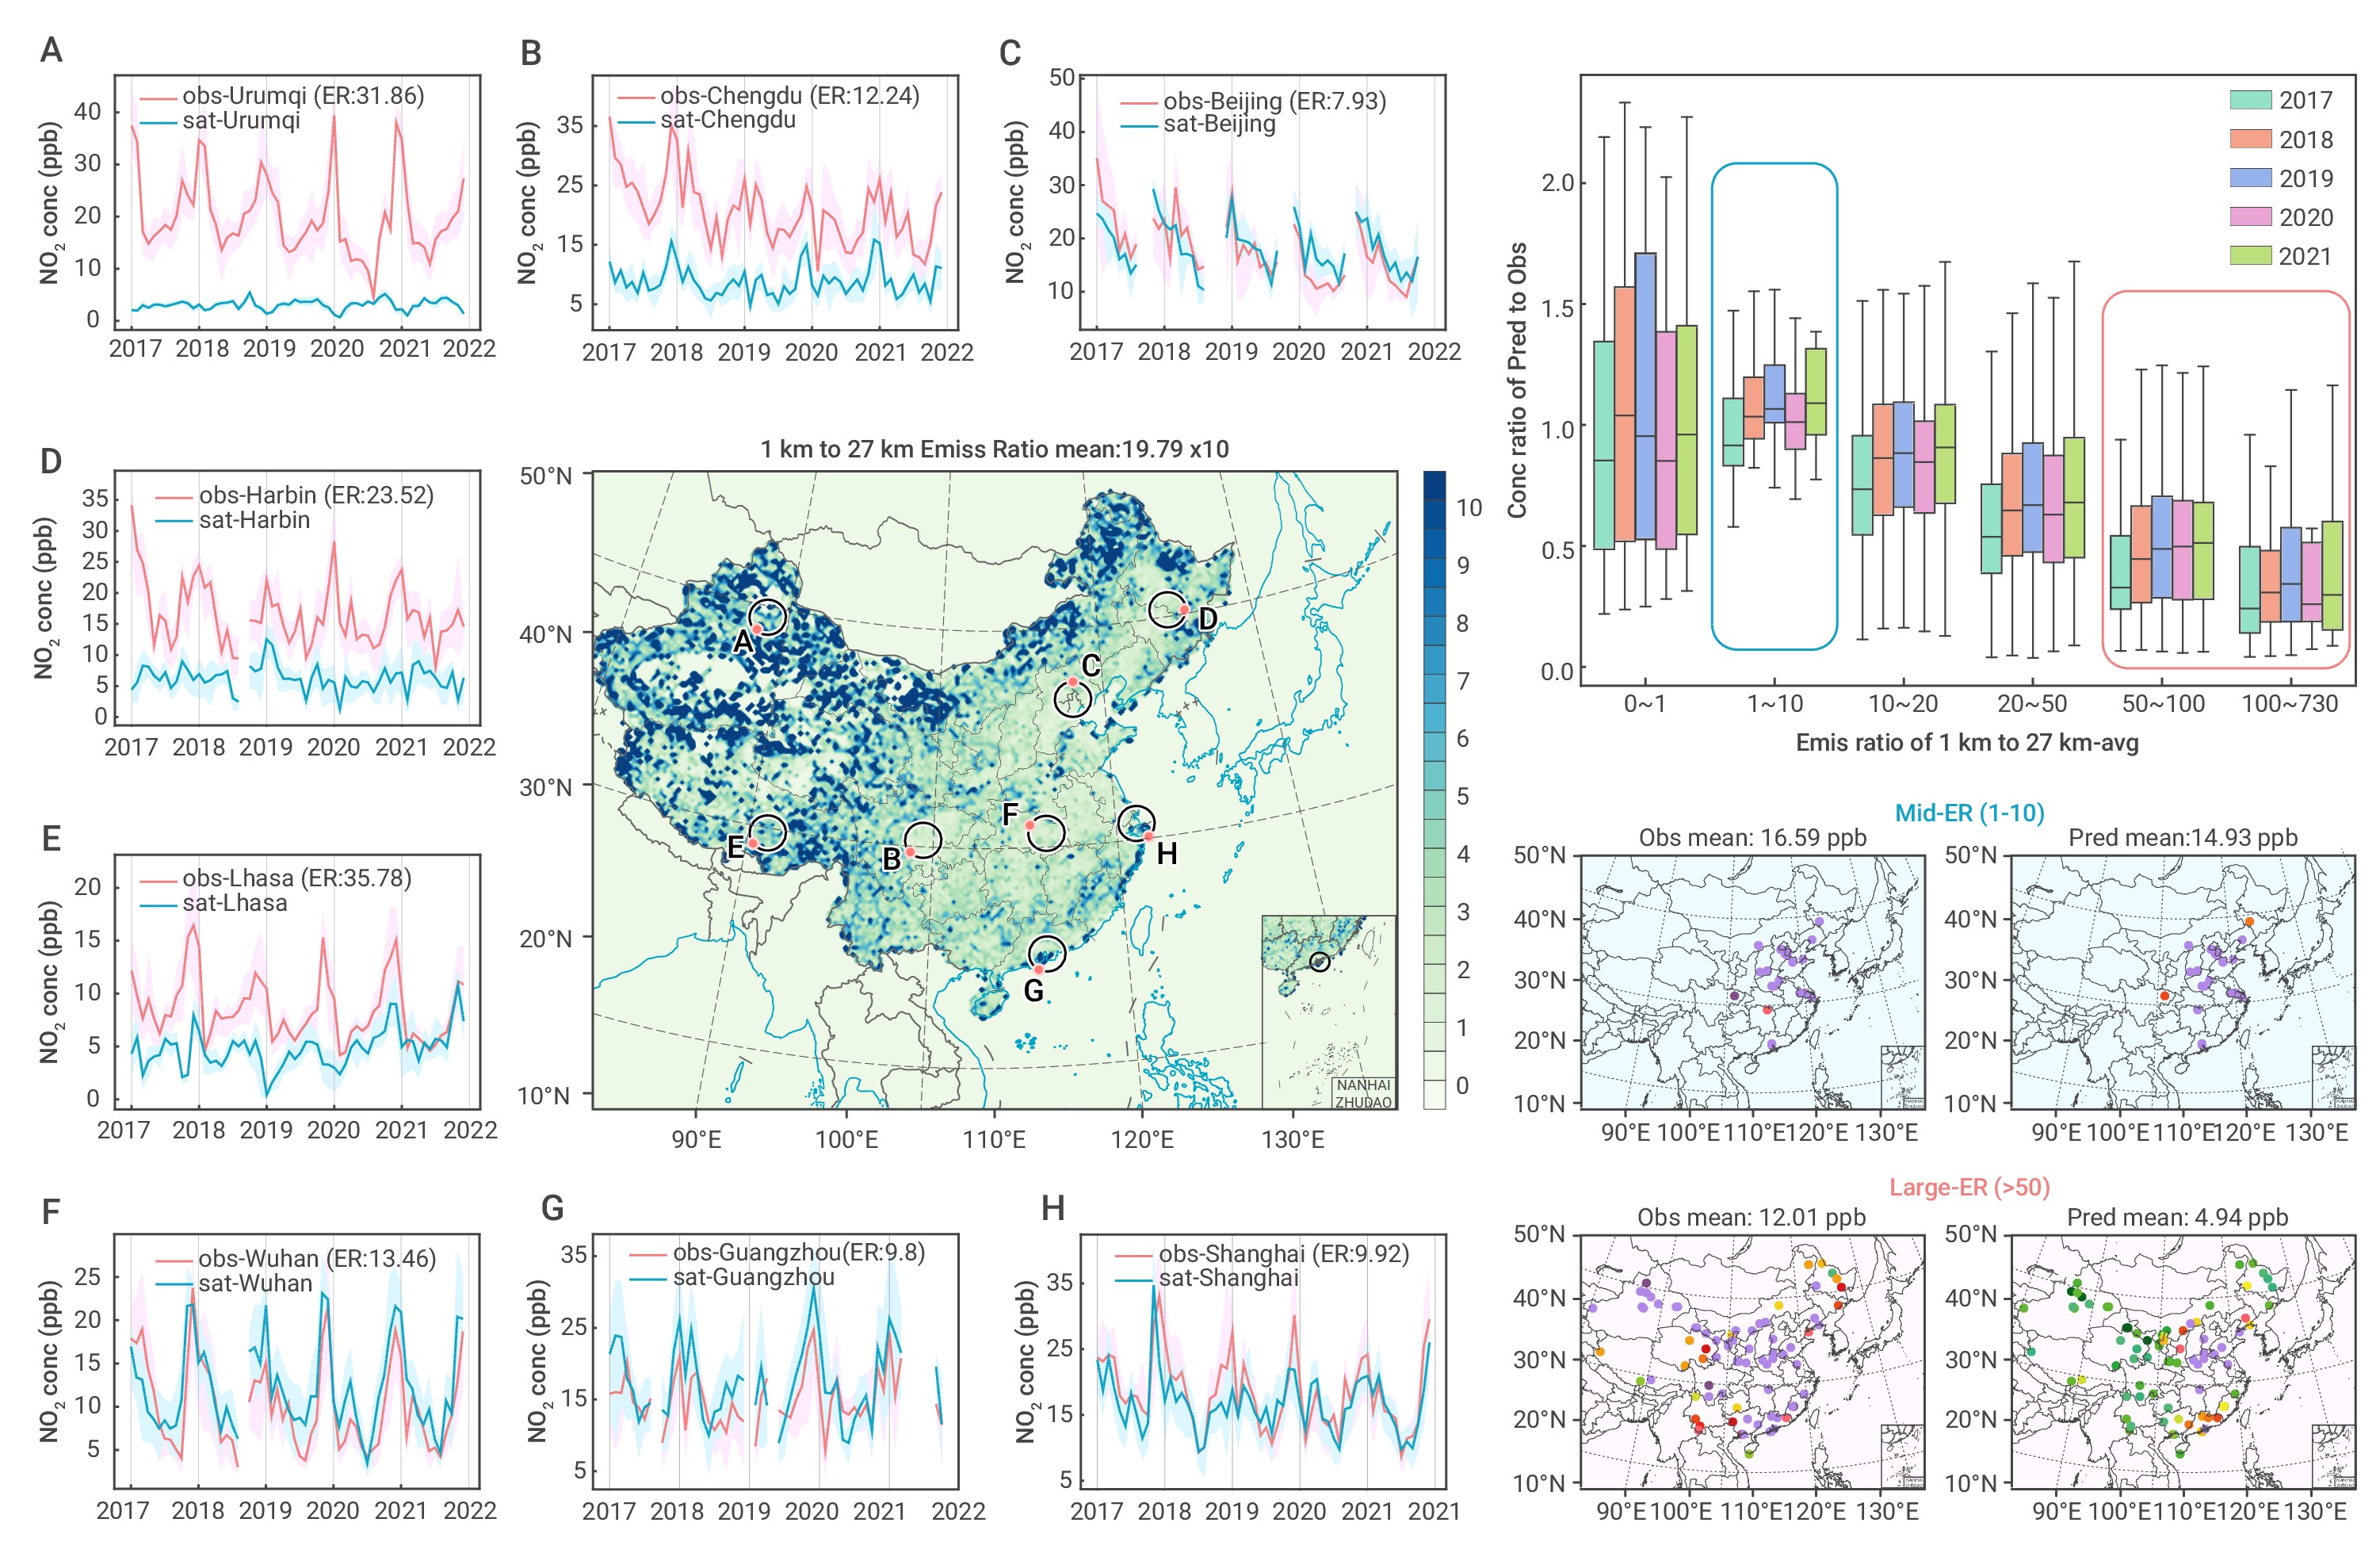
Figure 4.
Trend of OMI-predict surface NO2 concentration with DeepSAT4D during 2017-2021 comparing with ground observation in eight cities with the spatial distribution of 1km-to-27km emission ratio (ER) (left), and the comparison between OMI-prediction and observations by different group of ER values (right) (ER<1 indicate the sum of the emission in 27km grid cell are zero according to the 1km gridded emission file).
-
Figure 5.
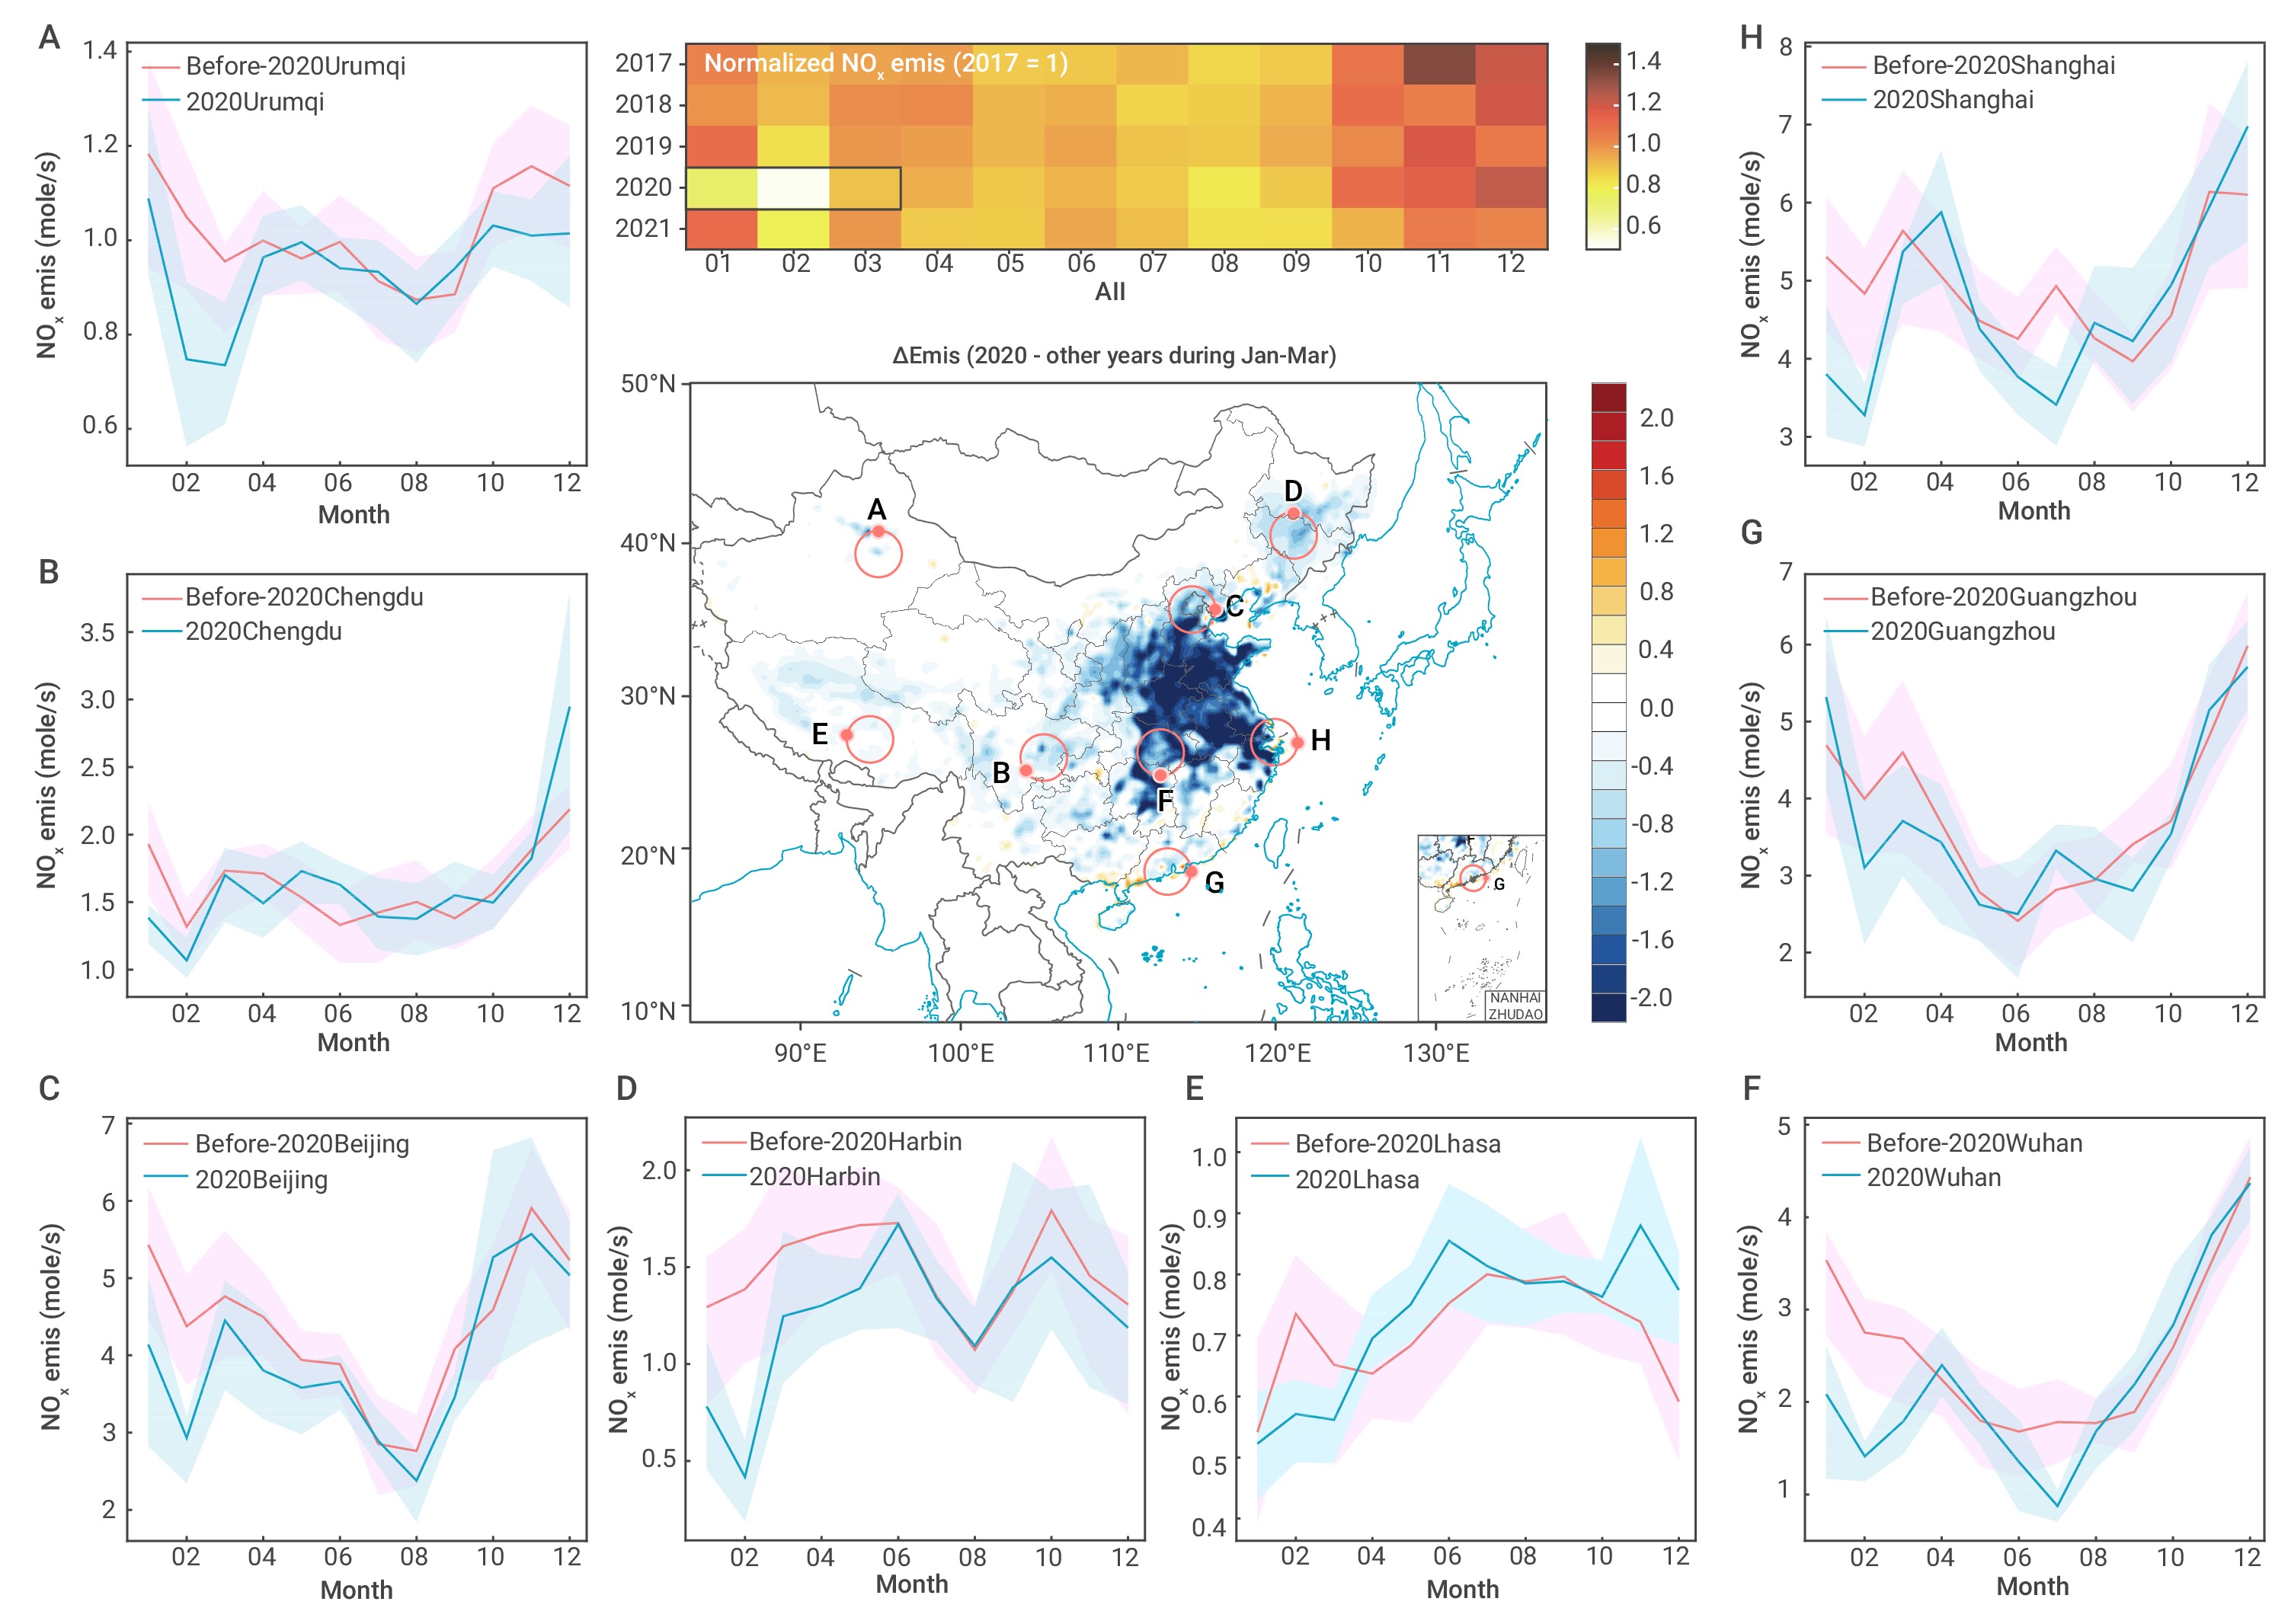
Estimated NOx emission variations by month, cites, and regions across 2017-2021 (unit: mol/s per 27km-by-27km grid cell).
