
A parallel-serial DNA nanodevice enables multichannel decoding of the BACE1-AS1/BACE1 axis in Alzheimer’s disease
-
GRAPHICAL ABSTRACT

 DownLoad:
Full size image
DownLoad:
Full size image
-
ABSTRACT
The accurate decoding of molecular interactions within disease related signaling pathways remains a central challenge for early and reliable diagnosis of Alzheimer’s disease (AD). While individual biomarkers such as BACE1 and its antisense transcript BACE1-AS1 have been widely studied, their coupled behavior within a functional axis is difficult to interpret using single output biosensing schemes. Here, we report a parallel–serial DNA nanodevice that translates the joint activity of the BACE1-AS1/BACE1 axis into structured, multichannel fluorescence outputs. Built around a hexagram DNA scaffold, the nanodevice undergoes distinct cleavage patterns in response to BACE1, BACE1-AS1, or their coexistence, which are subsequently converted into programmable downstream logic operations. Unlike conventional AND or OR logic gates that produce a single binary signal, this design combines parallel recognition with serial validation, generating three coordinated fluorescence readouts that reflect different states of pathway activity. By integrating the multichannel outputs with machine learning (ML) models, AD samples can be validated. Feature attribution analysis further reveals that BACE1-AS1 contributes more strongly than BACE1 to the diagnostic decision. By coupling DNA logic with multichannel signal cooperation, this work provides a practical route for translating molecular inputs into pathway level descriptions and clinically interpretable outcomes in AD. -

-
REFERENCES
[1] Shen, Y., Timsina, J., Heo, G., et al. (2024). CSF proteomics identifies early changes in autosomal dominant Alzheimer’s disease. Cell 18:6309−6326. DOI:10.1016/j.cell.2024.08.049 [2] Teunissen, C.E., Verberk, I.M.W., Thijssen, E.H., et al. (2022). Blood-based biomarkers for Alzheimer’s disease: towards clinical implementation. Lancet Neurol. 21:66−77. DOI:10.1016/s1474-4422(21)00361-6 [3] Hou, K., Ge, P., Sawaya, M.R., et al. (2025). How short peptides disassemble tau fibrils in Alzheimer’s disease. Nature 644:1020−1027. DOI:10.1038/s41586-025-09244-z [4] Scheltens, P., De S, B., Kivipelto, M., et al. (2021). Alzheimer’s disease. Lancet 39:1577−1590. DOI:10.1016/S0140-6736(20)32205-4 [5] Cheng, T., Jiao, K., Sun, M.Y., et al. (2024). Internal-driven DNA nanowindmill: multi-fulcrum mediated amplified rolling nanomachine for fast and ultrasensitive electrochemical detection of tau. Sens. Actuators B. Chem. 423:136797. DOI:10.1016/j.snb.2024.136797 [6] Mahaman, Y.A.R., Embaye, K.S., Huang, F., et al. (2022). Biomarkers used in Alzheimer’s disease diagnosis, treatment, and prevention. Ageing Res. Rev. 74:101544. DOI:10.1016/j.arr.2021.101544 [7] Hu, S., Zhang, L., Su, Y., et al. (2024). Sensitive detection of multiple blood biomarkers via immunomagnetic exosomal PCR for the diagnosis of Alzheimer’s disease. Sci. Adv. 10:eabm3088. DOI: https://www.science.org/doi/10.1126/sciadv.abm3088. [8] Aron, L., Ngian, Z.K., Qiu, C., et al. (2025). Lithium deficiency and the onset of Alzheimer’s disease. Nature 645:712−721. DOI:10.1038/s41586-025-09335-x [9] Yang, W., Shi, Y., Zhang, Y., et al. (2024). Intranasal carrier-free nanomodulator addresses both symptomatology and etiology of Alzheimer’s disease by restoring neuron plasticity and reprogramming lesion microenvironment. ACS Nano 18:29779−29793. DOI:10.1021/acsnano.4c09449 [10] Bao, J., Qin, M., Mahaman, Y.A.R., et al. (2018). BACE1 sumoylation increases its stability and escalates the protease activity in Alzheimer’s disease. Proc. Natl. Acad. Sci. U S A. 115:3954−3959. DOI:10.1073/pnas.1800498115 [11] Meakin, P.J., Mezzapesa, A., Benabou, E., et al. (2018). The beta secretase BACE1 regulates the expression of insulin receptor in the liver. Nat. Commun. 9:1306. DOI:10.1038/s41467-018-03755-2 [12] Fotuhi, S.N., Khalaj-Kondori, M., Hoseinpour Feizi, M.A., et al. (2019). Long non-coding RNA BACE1-AS may serve as an Alzheimer’s disease blood-based biomarker. J. Mol. Neurosci. 69:351−359. DOI:10.1007/s12031-019-01364-2 [13] Zeng, T., Ni, H., Yu, Y., et al. (2019). BACE1-AS prevents BACE1 mRNA degradation through the sequestration of BACE1-targeting miRNAs. J. Chem. Neuroanat. 98:87−96. DOI:10.1016/j.jchemneu.2019.04.001 [14] Lim, J., Van A, B., Koprowski, K., et al. (2025). Amplification-free, or-gated Crispr-cascade reaction for pathogen detection in blood samples. Proc. Natl. Acad. Sci. USA. 122:e2420166122. DOI:10.1073/pnas.2420166122 [15] Tu, T., Huan, S., Feng, X., et al. (2025). Spatial confinement of a dual activatable DNAzyme sensor in the cavity of a DNA nanocage for logic-gated molecular imaging. Angew. Chem. Int. Ed. 64:e202424684. DOI:10.1002/anie.202424684 [16] Yang, Q., Dong, M.J., Xu, J., et al. (2025). Crispr/RNA aptamer system activated by an and logic gate for biomarker-driven theranostics. J. Am. Chem. Soc. 147:169−180. DOI:10.1021/jacs.4c08719 [17] Wei, J., Wang, H., Wu, Q., et al. (2020). A smart, autocatalytic, DNAzyme biocircuit for in vivo, amplified, miRNA imaging. Angew. Chem. Int. Ed. 59:5965−5971. DOI:10.1002/anie.201911712 [18] Afshan, N., Cheng, T., Yu, J., et al. (2025). Catalytic hairpin assembly-based förster resonance energy transfer biosensor for simultaneous detection of multiple miRNAs from breast cancer. Anal. Chim. Acta 1352:343925. DOI:10.1016/j.aca.2025.343925 [19] Wang, G., Cheng, T., Yuan, H., et al. (2023). Tracing cellular interaction of circRNA-miRNA axis with cu metal-organic framework supported DNA cascade assembly. Biosens. Bioelectron. 228:115226. DOI:10.1016/j.bios.2023.115226 [20] Miao, P. (2023). Magnetic multipedal DNA walking nanomachine driven by catalytic hairpin assembly. Anal. Chem. 95:6760−6764. DOI:10.1021/acs.analchem.3c00427 [21] Meng, X., Wang, H., Yang, M., et al. (2021). Target-cell-specific bioorthogonal and endogenous ATP control of signal amplification for intracellular miRNA imaging. Anal. Chem. 93:1693−1701. DOI:10.1021/acs.analchem.0c04302 [22] Mao, D., Tang, X., Zhang, R., et al. (2025). Multichrome encoding-based multiplexed, spatially resolved imaging reveals single-cell RNA epigenetic modifications heterogeneity. Nat. Commun. 16:958. DOI:10.1038/s41467-025-56331-w [23] Mao, D., Gou, H., Chen, W., et al. (2025). Enzymatic DNA orthogonal chemistry for multi-cancer diagnosis. Chem 11:102656. DOI:10.1016/j.chempr.2025.102656 [24] Wang, Y., Li, H., Cao, X., et al. (2025). In situ multiplexed imaging of miRNA heterogeneity in single urinary exosome enables non-invasive bladder cancer diagnosis. Chem. Eng. J. 523:168311. DOI:10.1016/j.cej.2025.168311 [25] Liu, L., Ju, P., Yang, K., et al. (2025). Extended linear confined zipper cascaded reaction for highly efficient intracellular imaging and assisting diagnosis of thyroid cancer. Small 21:e2500202. DOI:10.1002/smll.202500202 [26] Guo, Y., Luo, S., Liu, S., et al. (2025). Bimodal in situ analyzer for circular RNA in extracellular vesicles combined with machine learning for accurate gastric cancer detection. Adv. Sci. 12:e2409202. DOI:10.1002/advs.202409202 [27] Zhang, Y.P., Chen, H.J., Hu, Y., et al. (2024). Accurate cancer screening and prediction of pd-l1-guided immunotherapy efficacy using quantum dot nanosphere self-assembly and machine learning. Nano Lett. 24:1816−1824. DOI:10.1021/acs.nanolett.3c05060 [28] Wang, S., Zhu, Y., Zhou, Z., et al. (2024). Integrated ultrasound-enrichment and machine learning in colorimetric lateral flow assay for accurate and sensitive clinical Alzheimer’s biomarker diagnosis. Adv. Sci. 11:e2406196. DOI:10.1002/advs.202406196 -
ABOUT THIS ARTICLE
Cite this article:
Cheng T., Yu J., Zhou H., et al. (2026). A parallel-serial DNA nanodevice enables multichannel decoding of the BACE1-AS1/BACE1 axis in Alzheimer’s disease. The Innovation Neurology 1:100005. https://doi.org/10.59717/j.tine.2026.100005
Welcome!
To request copyright permission to republish or share portions of our works, please visit Copyright Clearance Center's (CCC) Marketplace website at marketplace.copyright.com.
Export File
Citation
Cheng T., Yu J., Zhou H., et al. (2026). A parallel-serial DNA nanodevice enables multichannel decoding of the BACE1-AS1/BACE1 axis in Alzheimer’s disease. The Innovation Neurology 1:100005. https://doi.org/10.59717/j.tine.2026.100005

Format
Content
-
Figure 1.
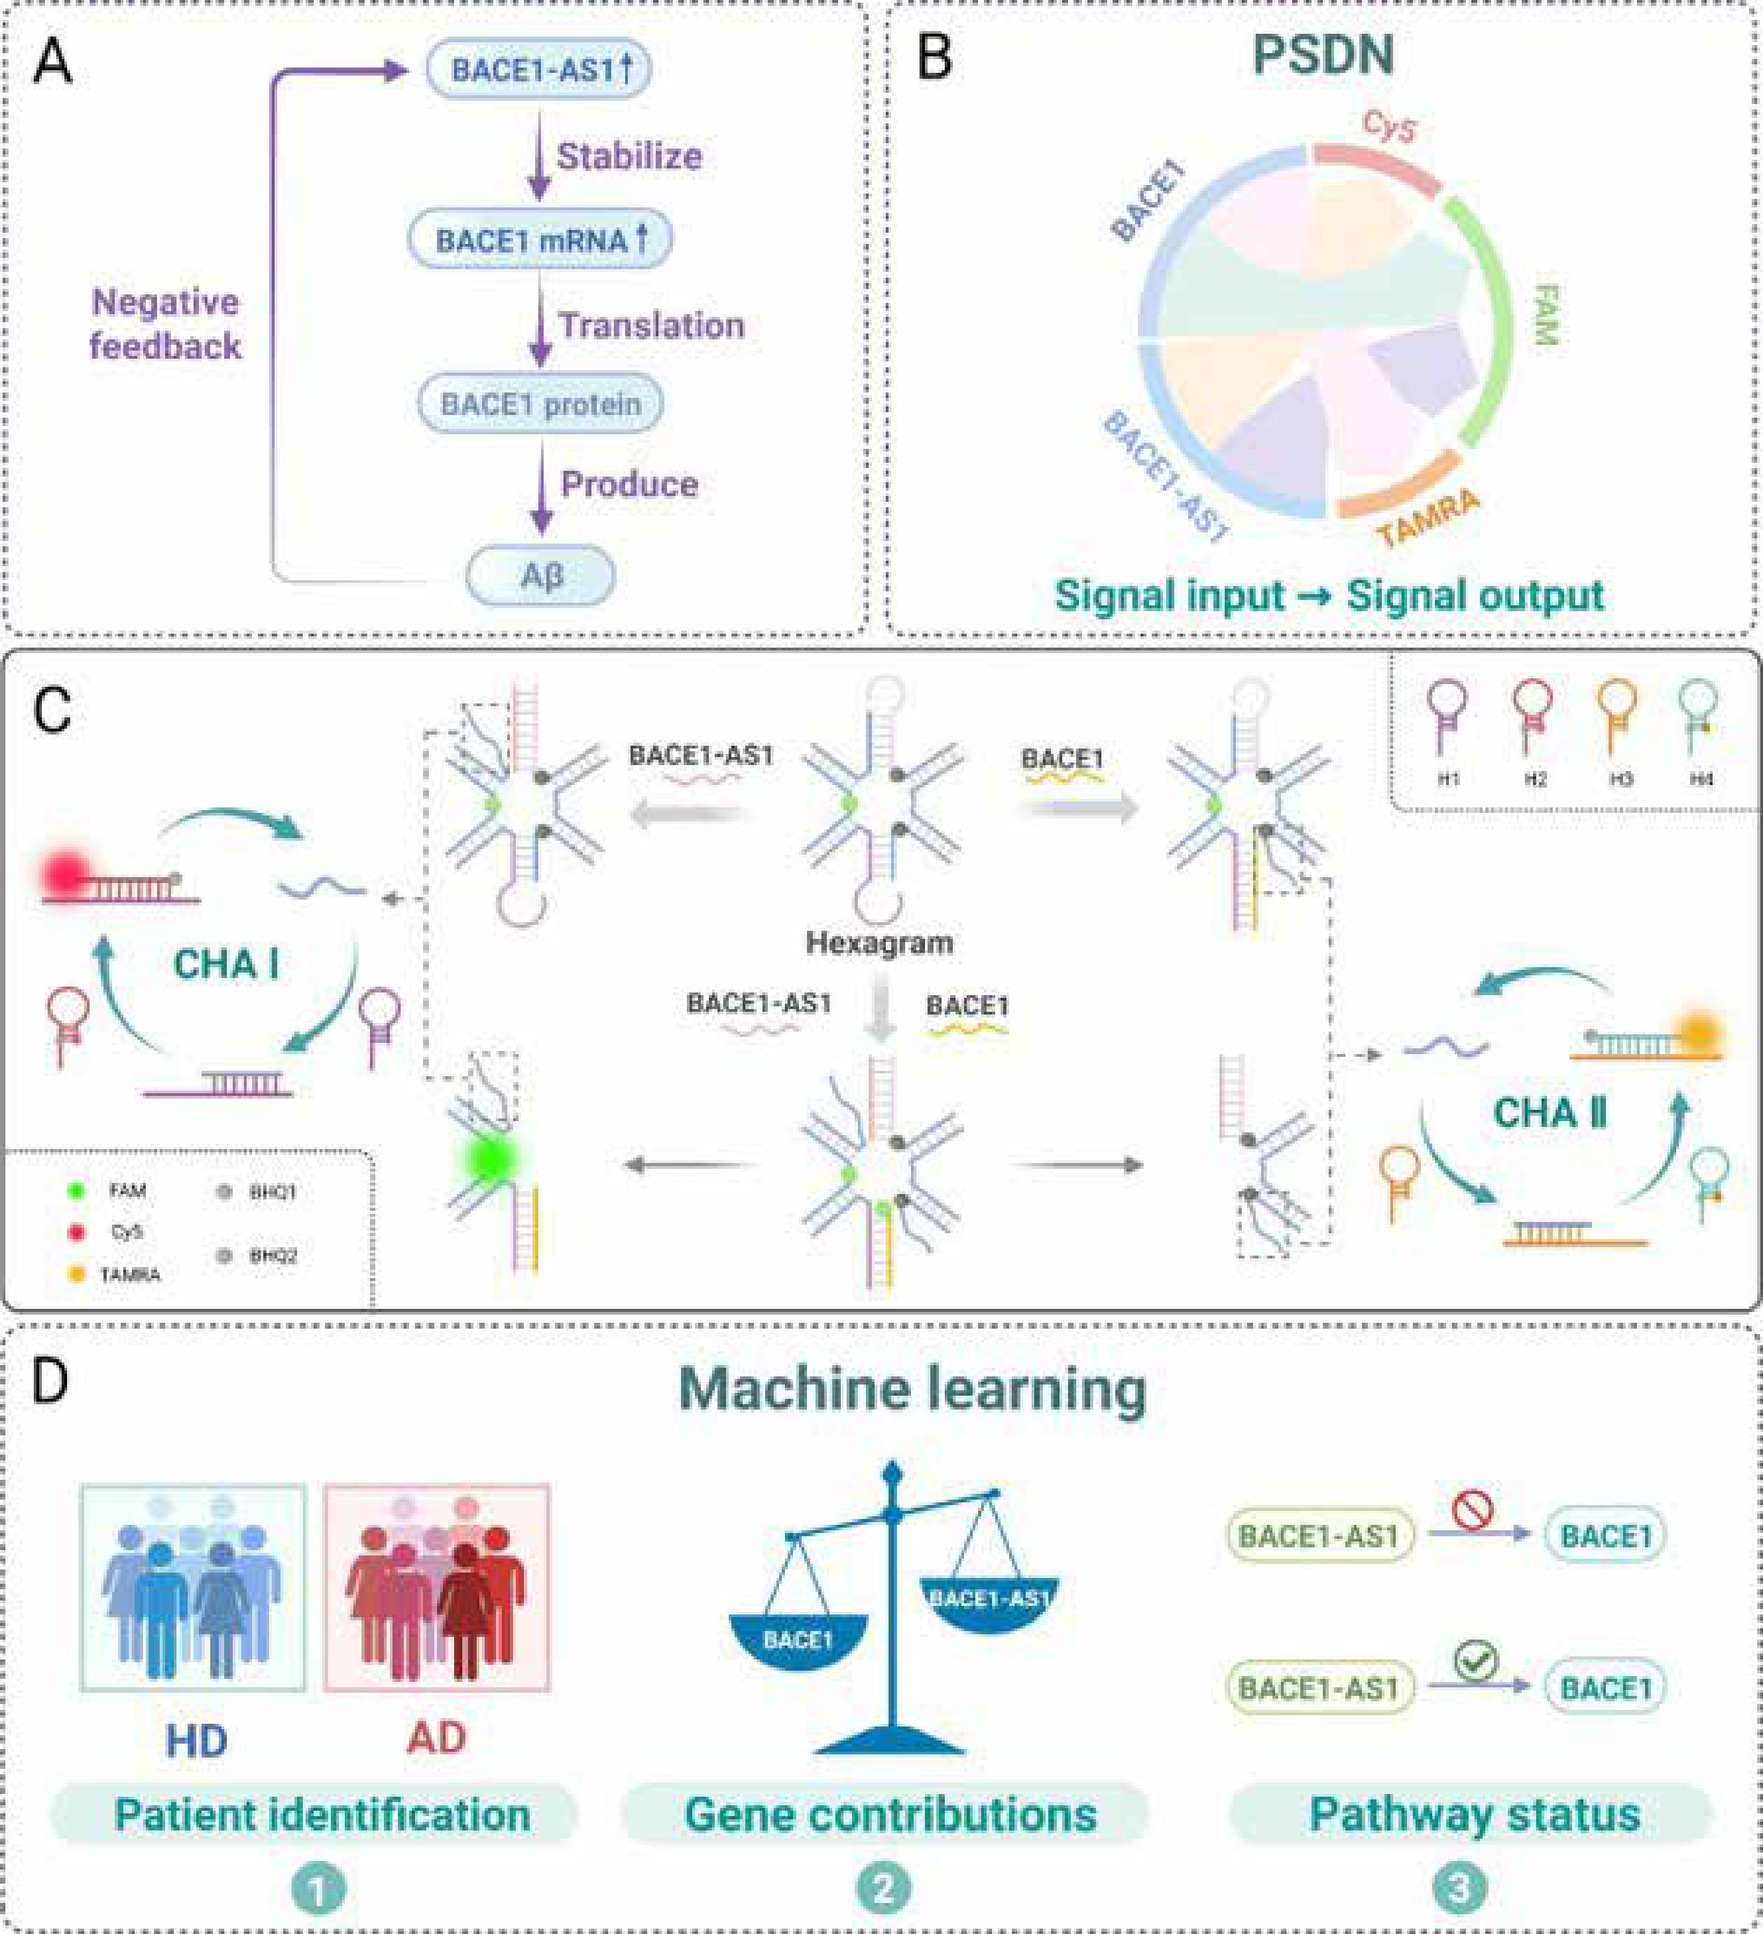
Schematic illustration of machine learning-enhanced parallel-serial DNA nanodevice (PSDN) for multidimensional dissection of the BACE-AS1/BACE1 axis.
-
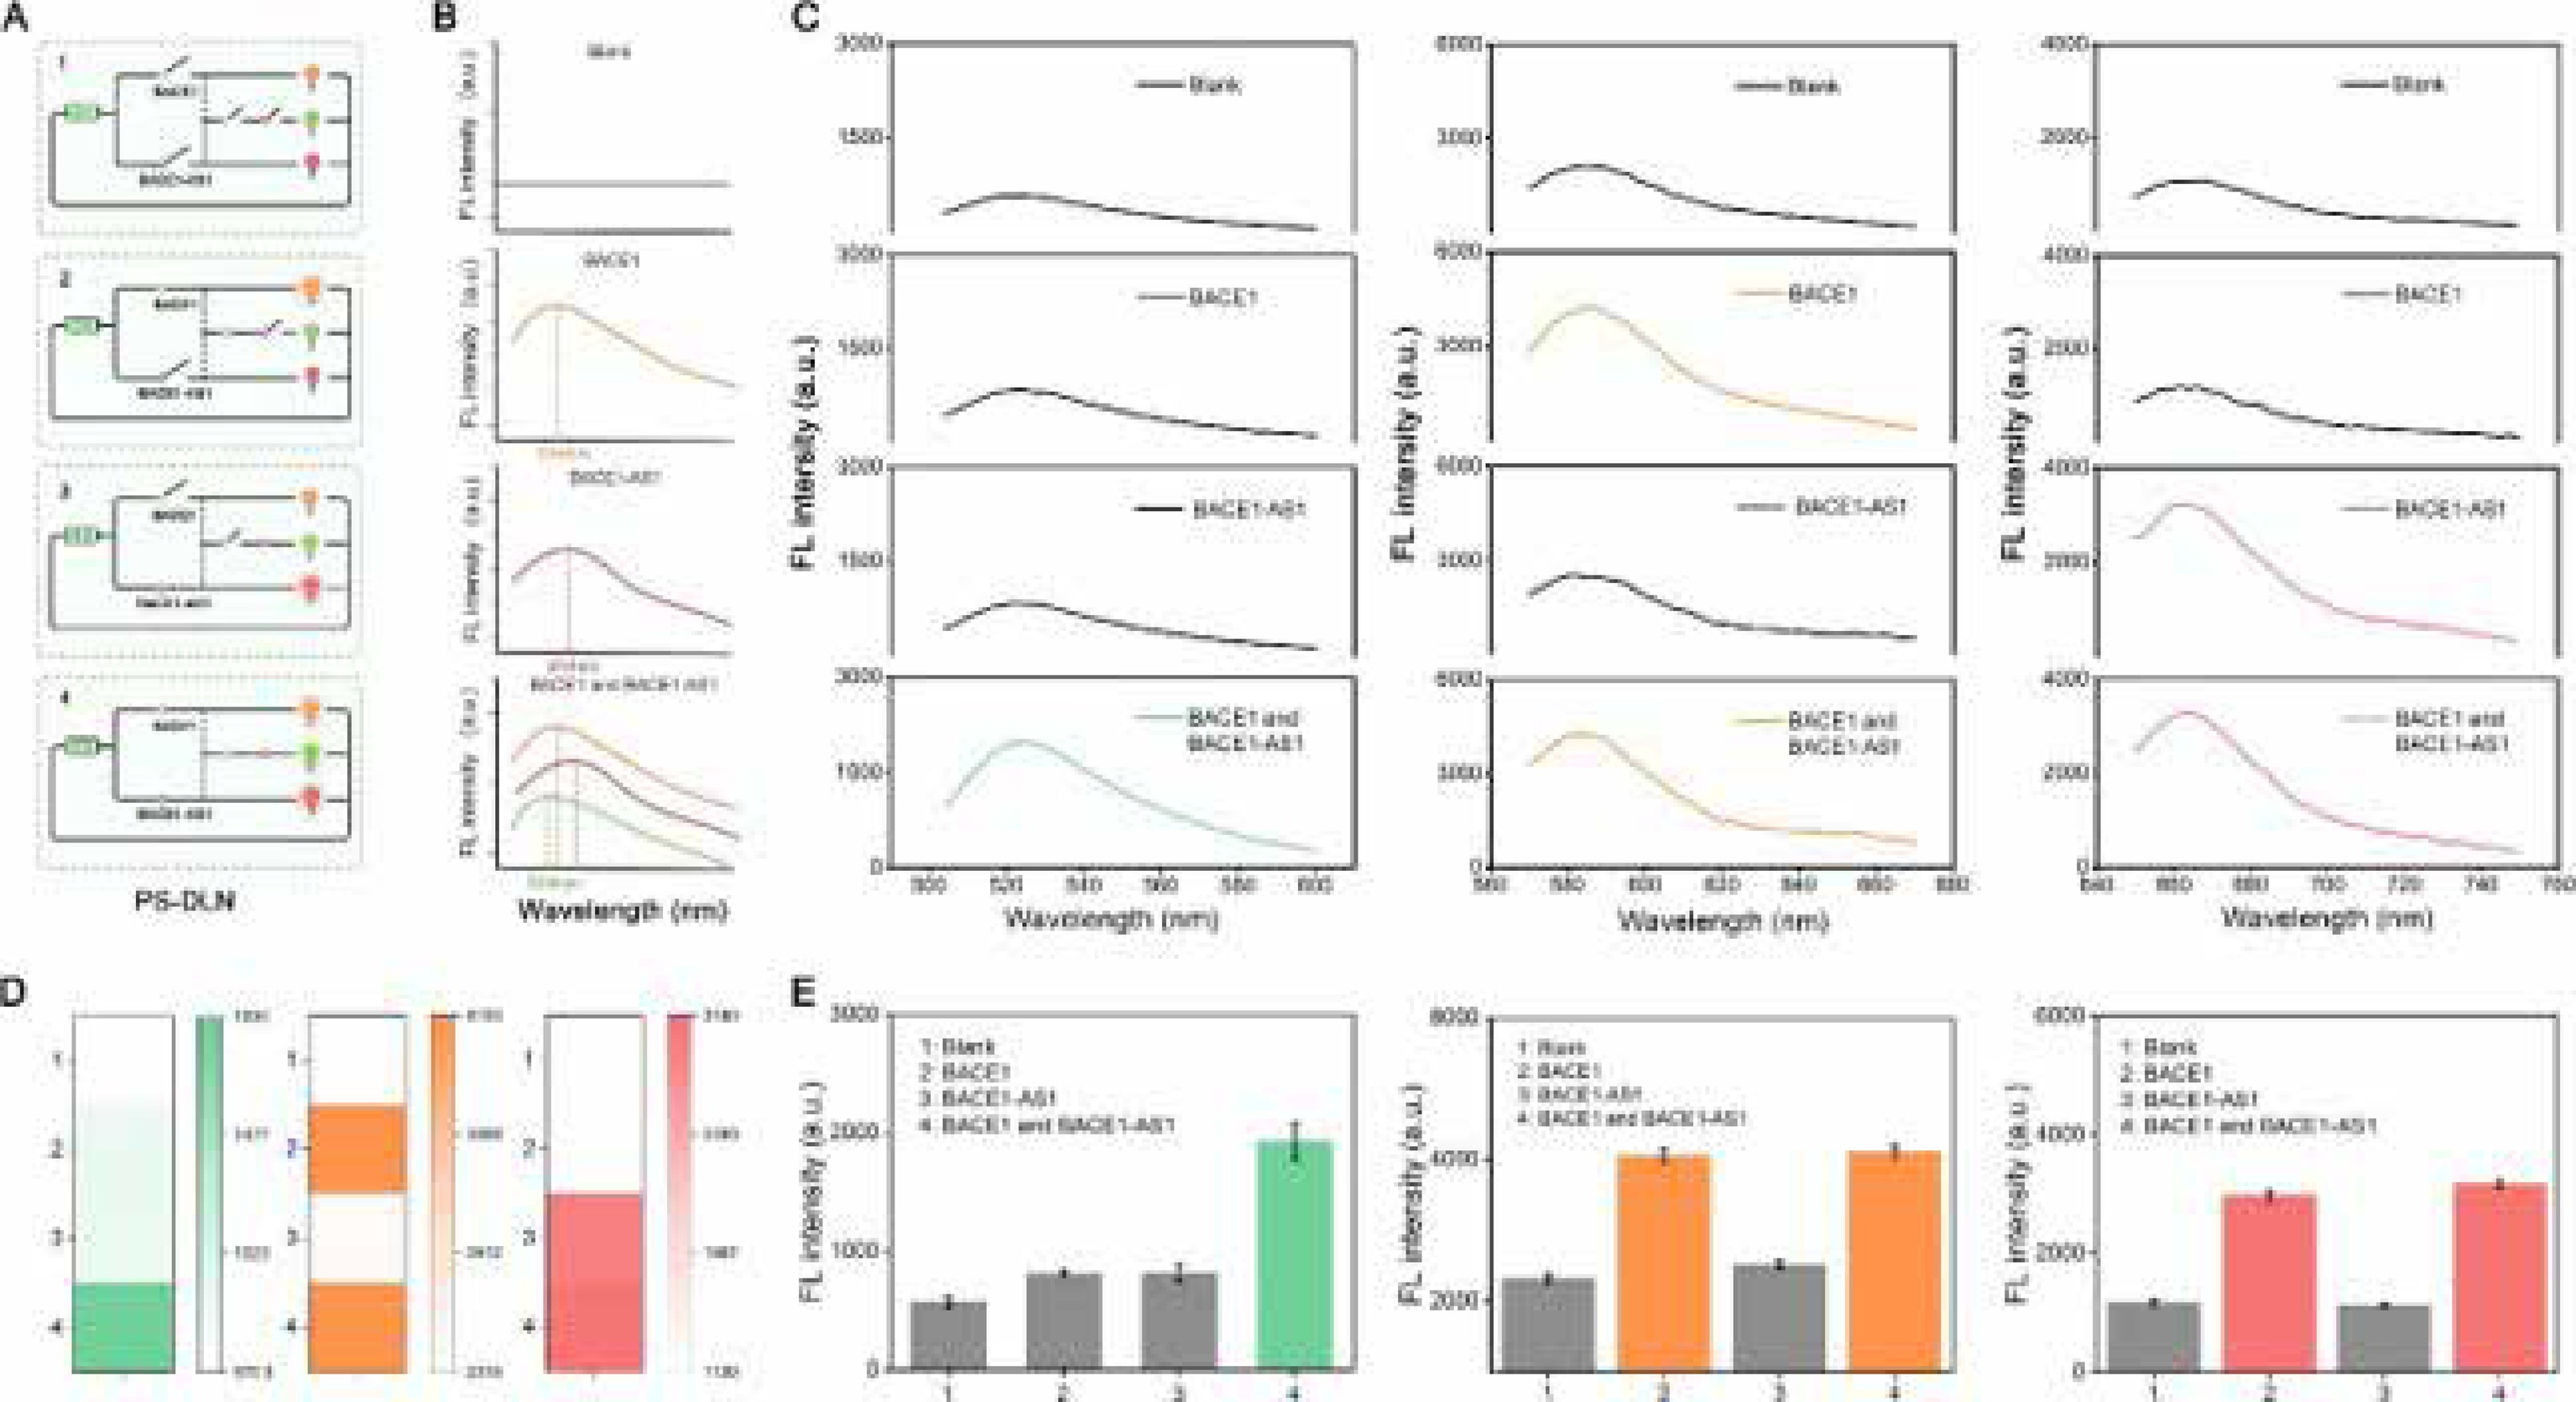
Figure 1.
(A) Schematic diagram of the PSDN system with BACE1 and BACE1 switches. (B) Graphical depiction of fluorescence responses to different inputs. (C) Fluorescence spectra analysis and (D) Heatmap of different inputs (Blank, BACE1, BACE1-AS1, BACE1 and BACE1-AS1) in three fluorescence channels: FAM (left), TAMRA (middle), and Cy5 (right). (E) Peak responses for the Blank, BACE1, BACE1-AS1, BACE1 and BACE1-AS1 in the three fluorescence channels (BACE1 concentration: 250 nM; BACE1-AS1 concentration: 250 nM). Error bars, SD, n=3.
-
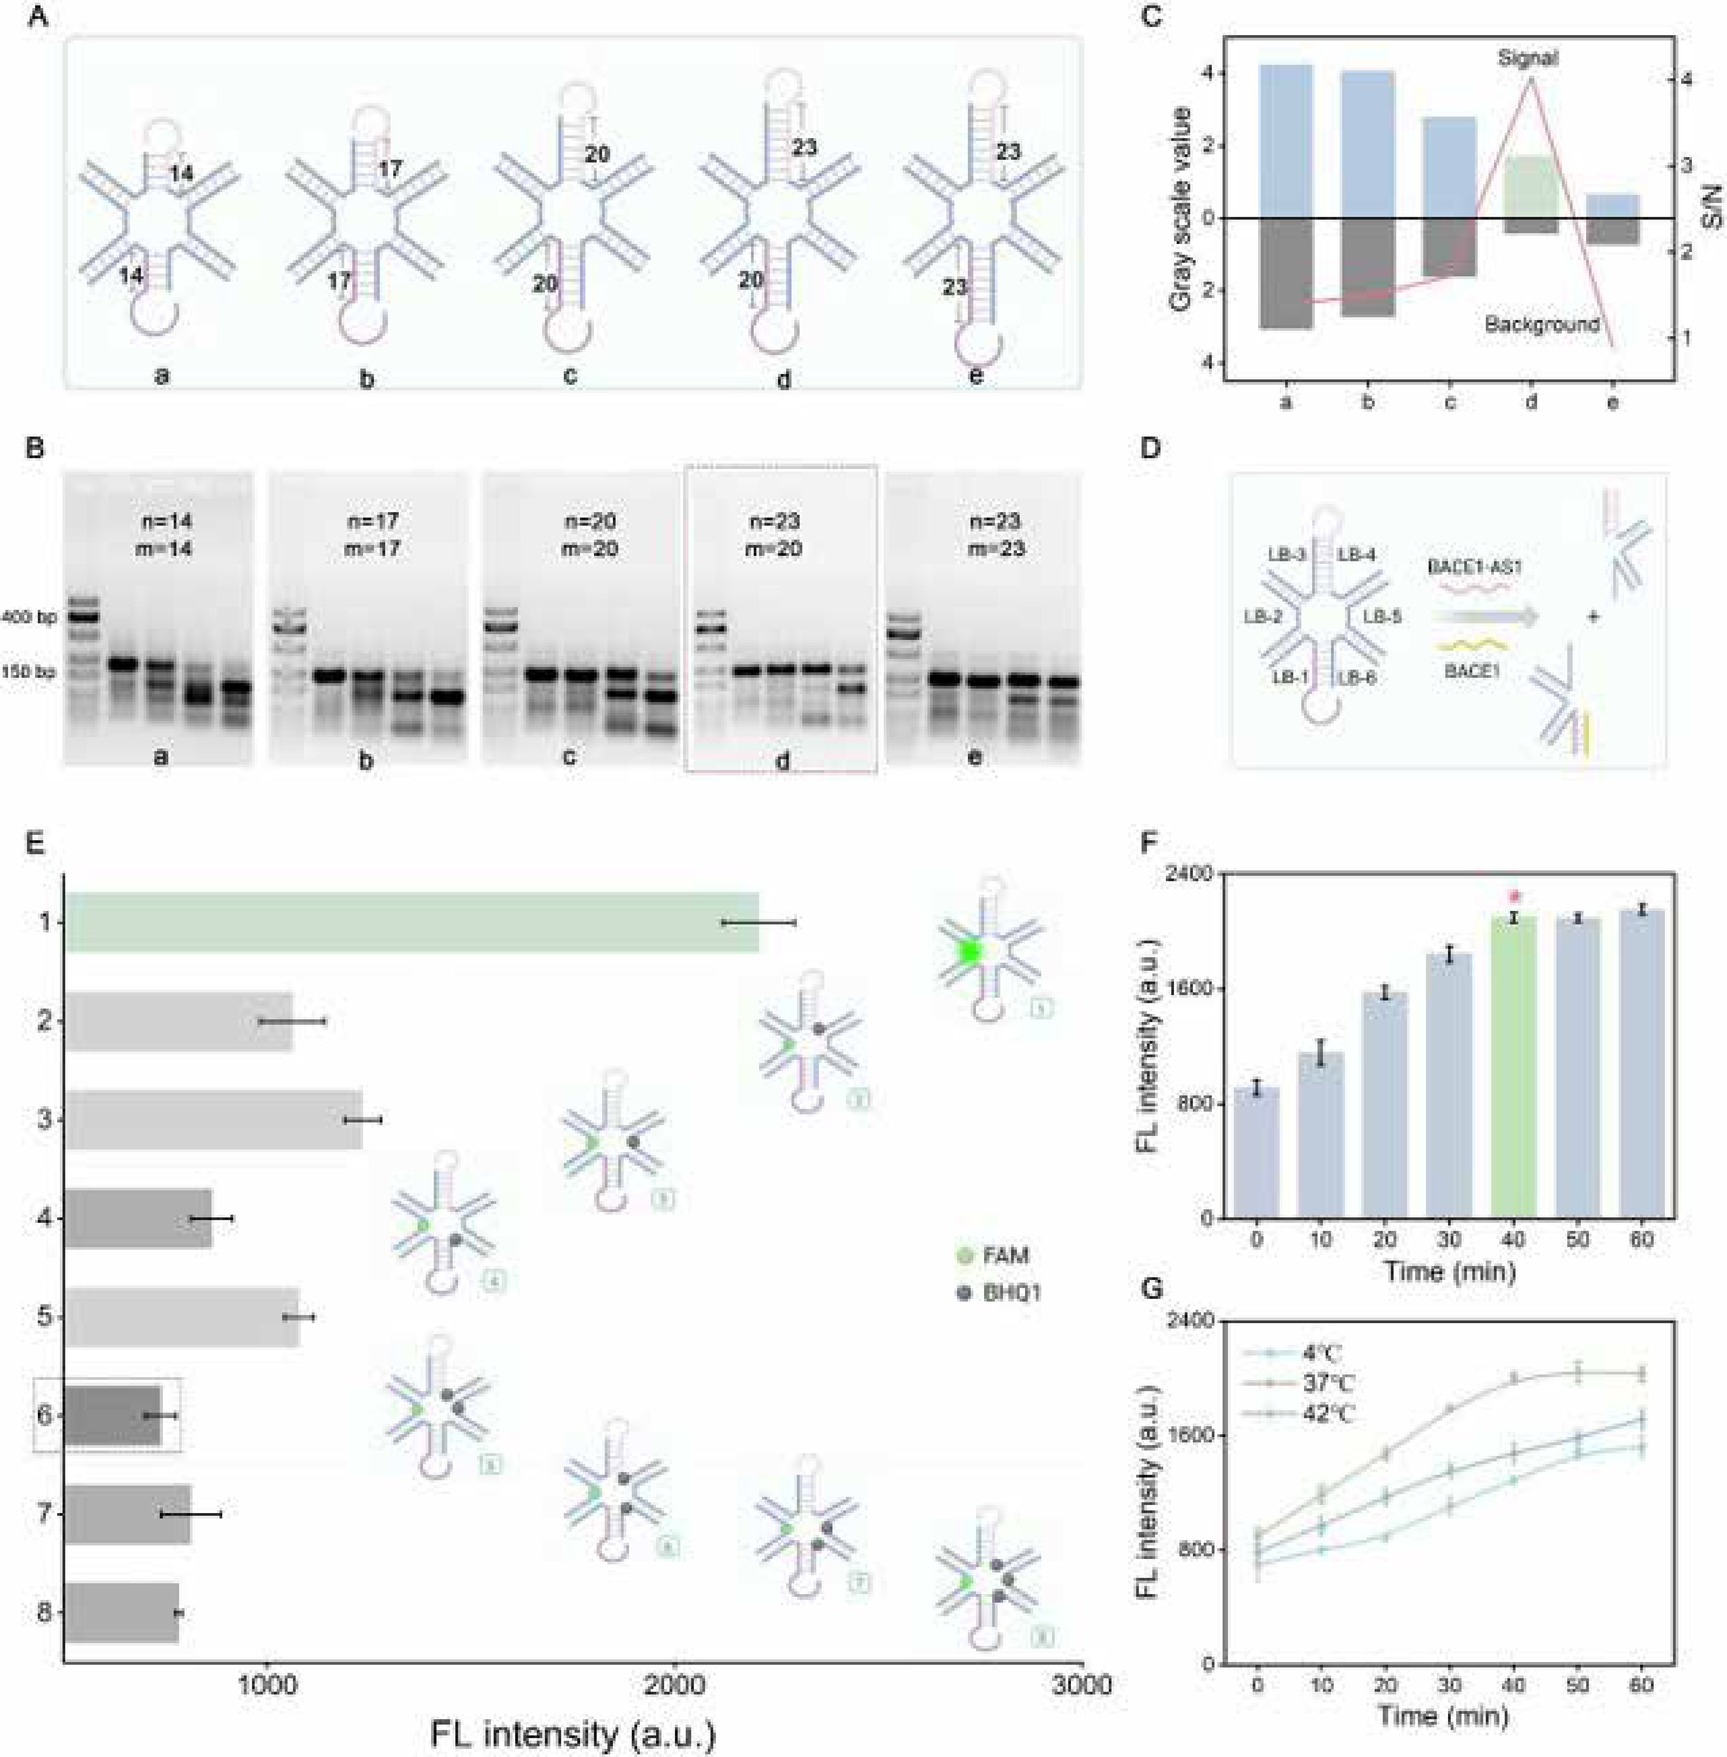
Figure 2.
(A) Schematic diagram of hexagram with different stem lengths. (B) Agarose gel for different inputs (a-e: lane 1: marker; lane 2: hexagram; lane 3: hexagram + BACE1; lane 4: hexagram + BACE1-AS1; lane 5: hexagram + BACE1 and BACE1-AS1). (C) Gel band quantification: new bands (separate BACE1-AS1/BACE1 = Background; co-addition = Signal). (D) Schematic diagram of the complete cleavage of the hexagram in the presence of BACE1 and BACE1-AS1. (E) Fluorescence of BHQ1-mediated FAM quenching at different positions. (F) Optimization reaction time of the proposed PSDN biosensor. (G) Optimization reaction temperature of the proposed PSDN biosensor. Error bars, SD, n=3.
-
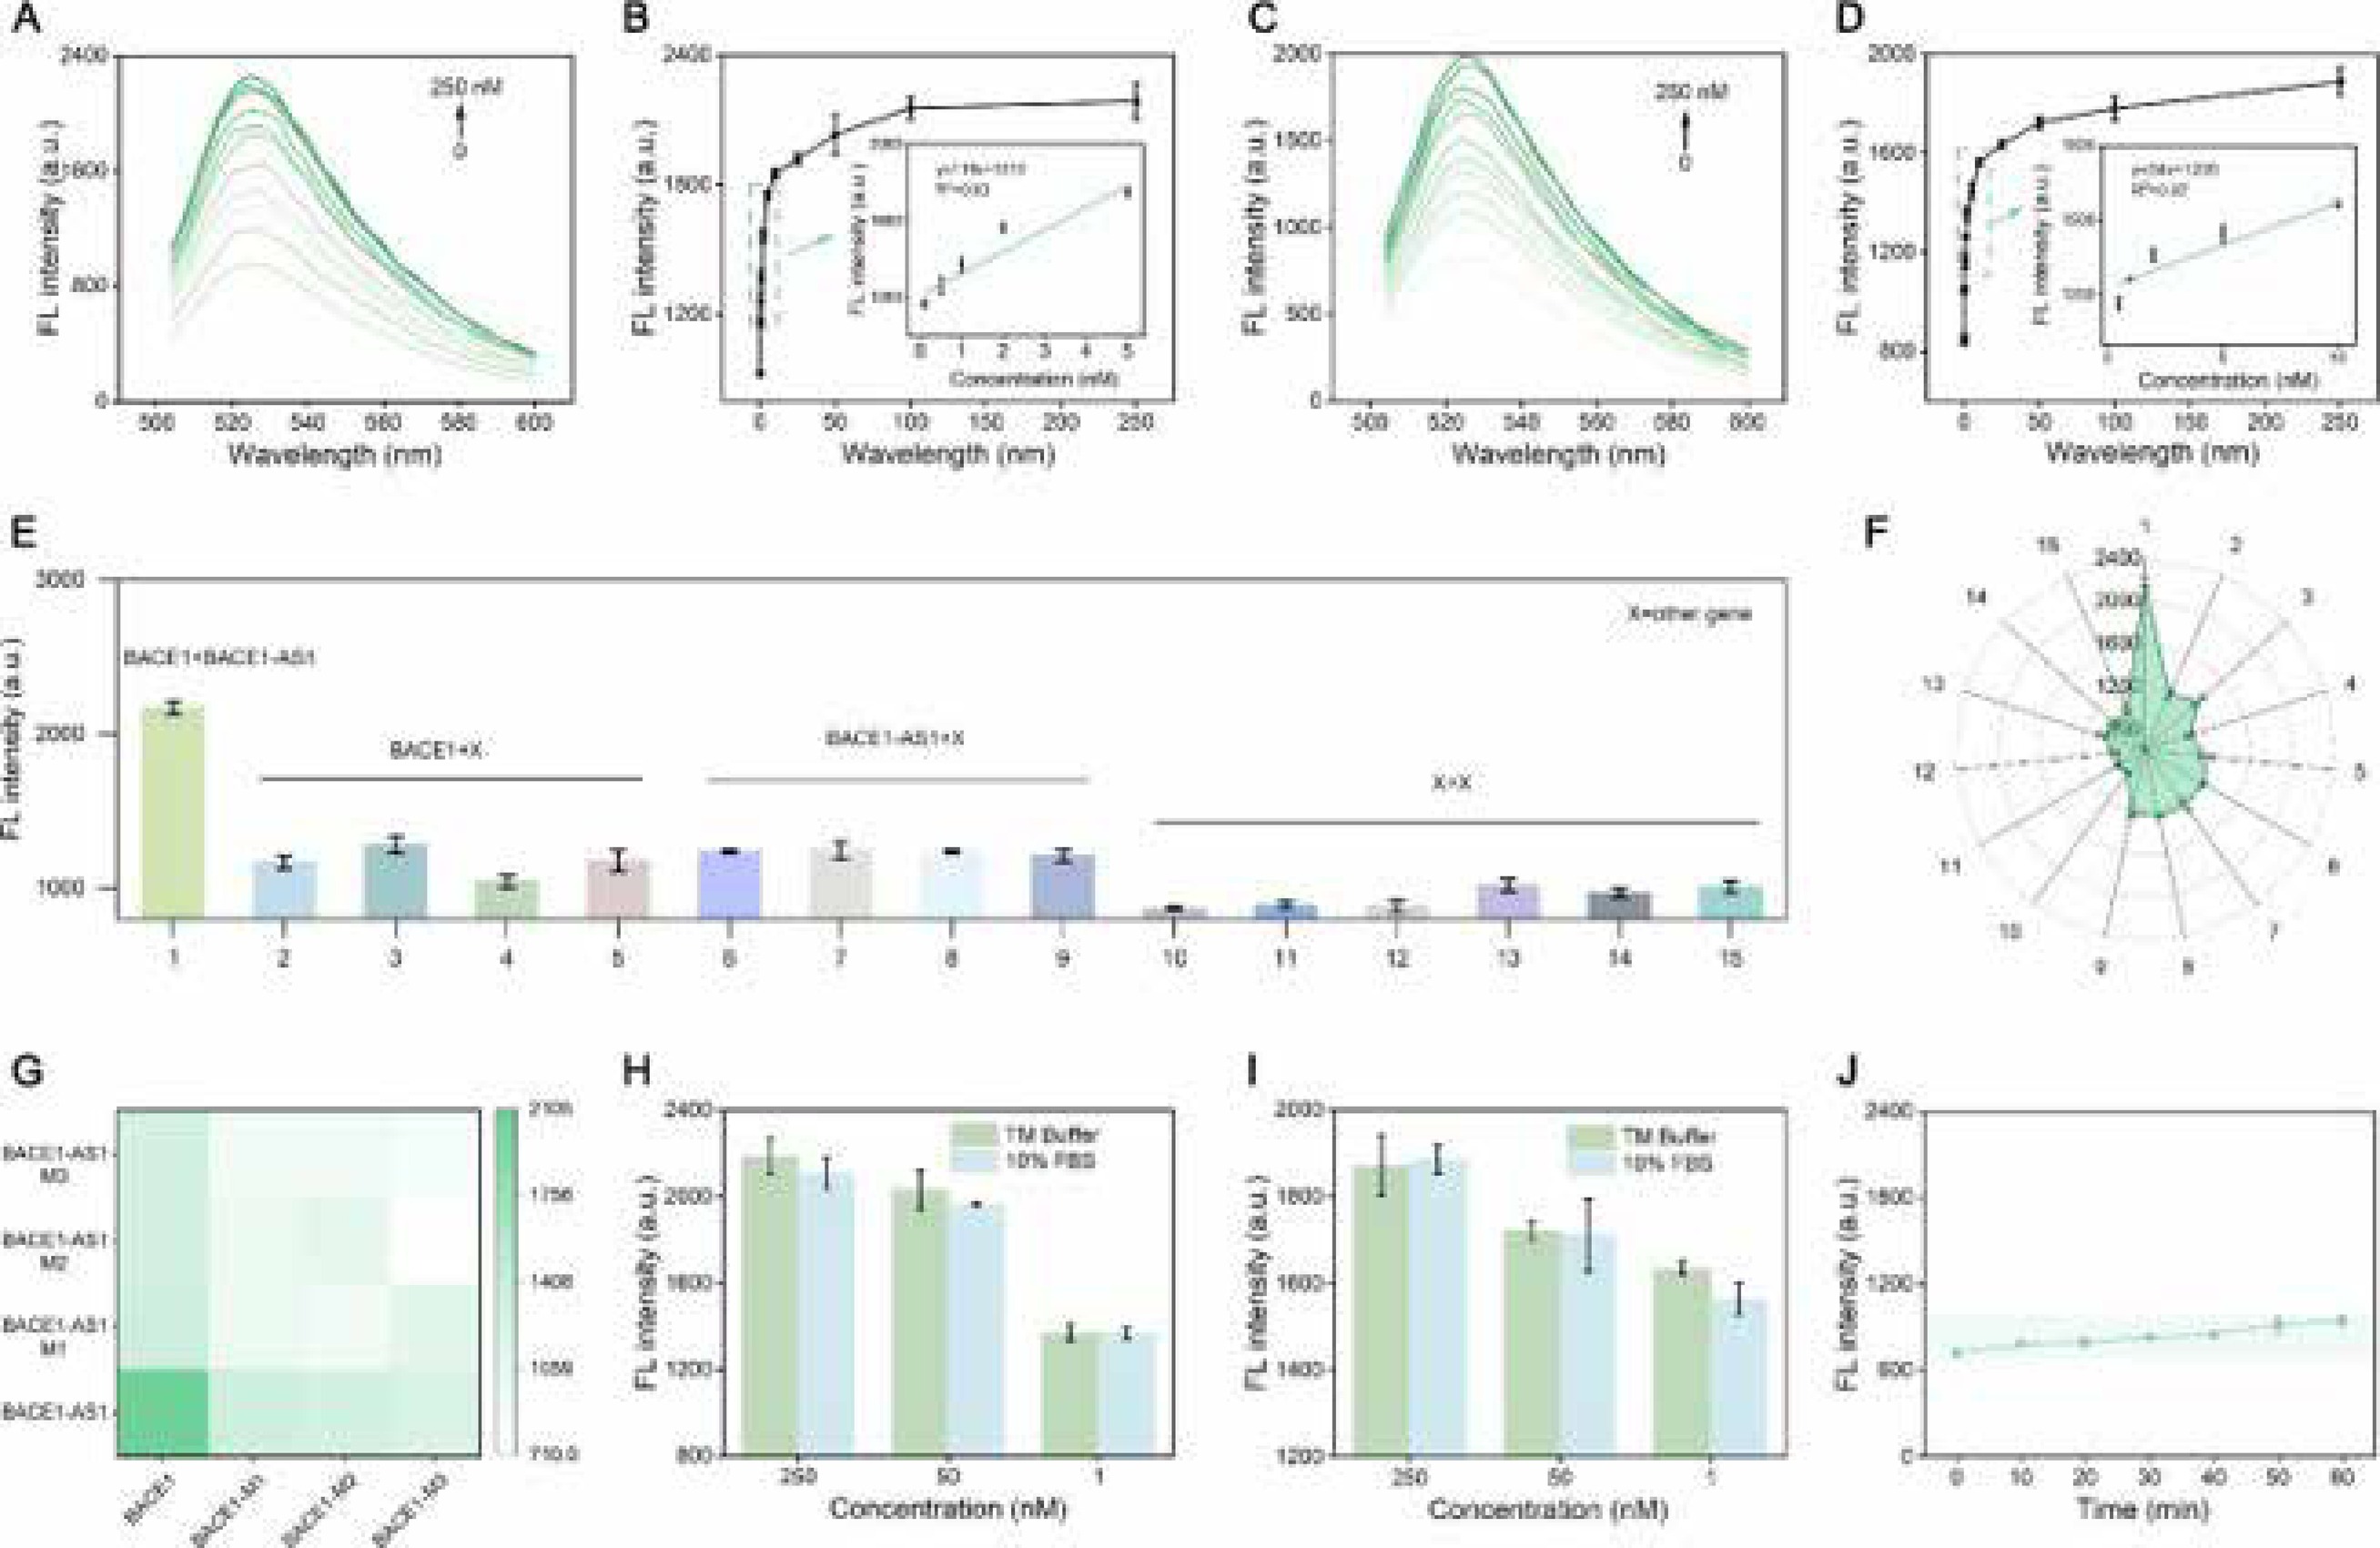
Figure 3.
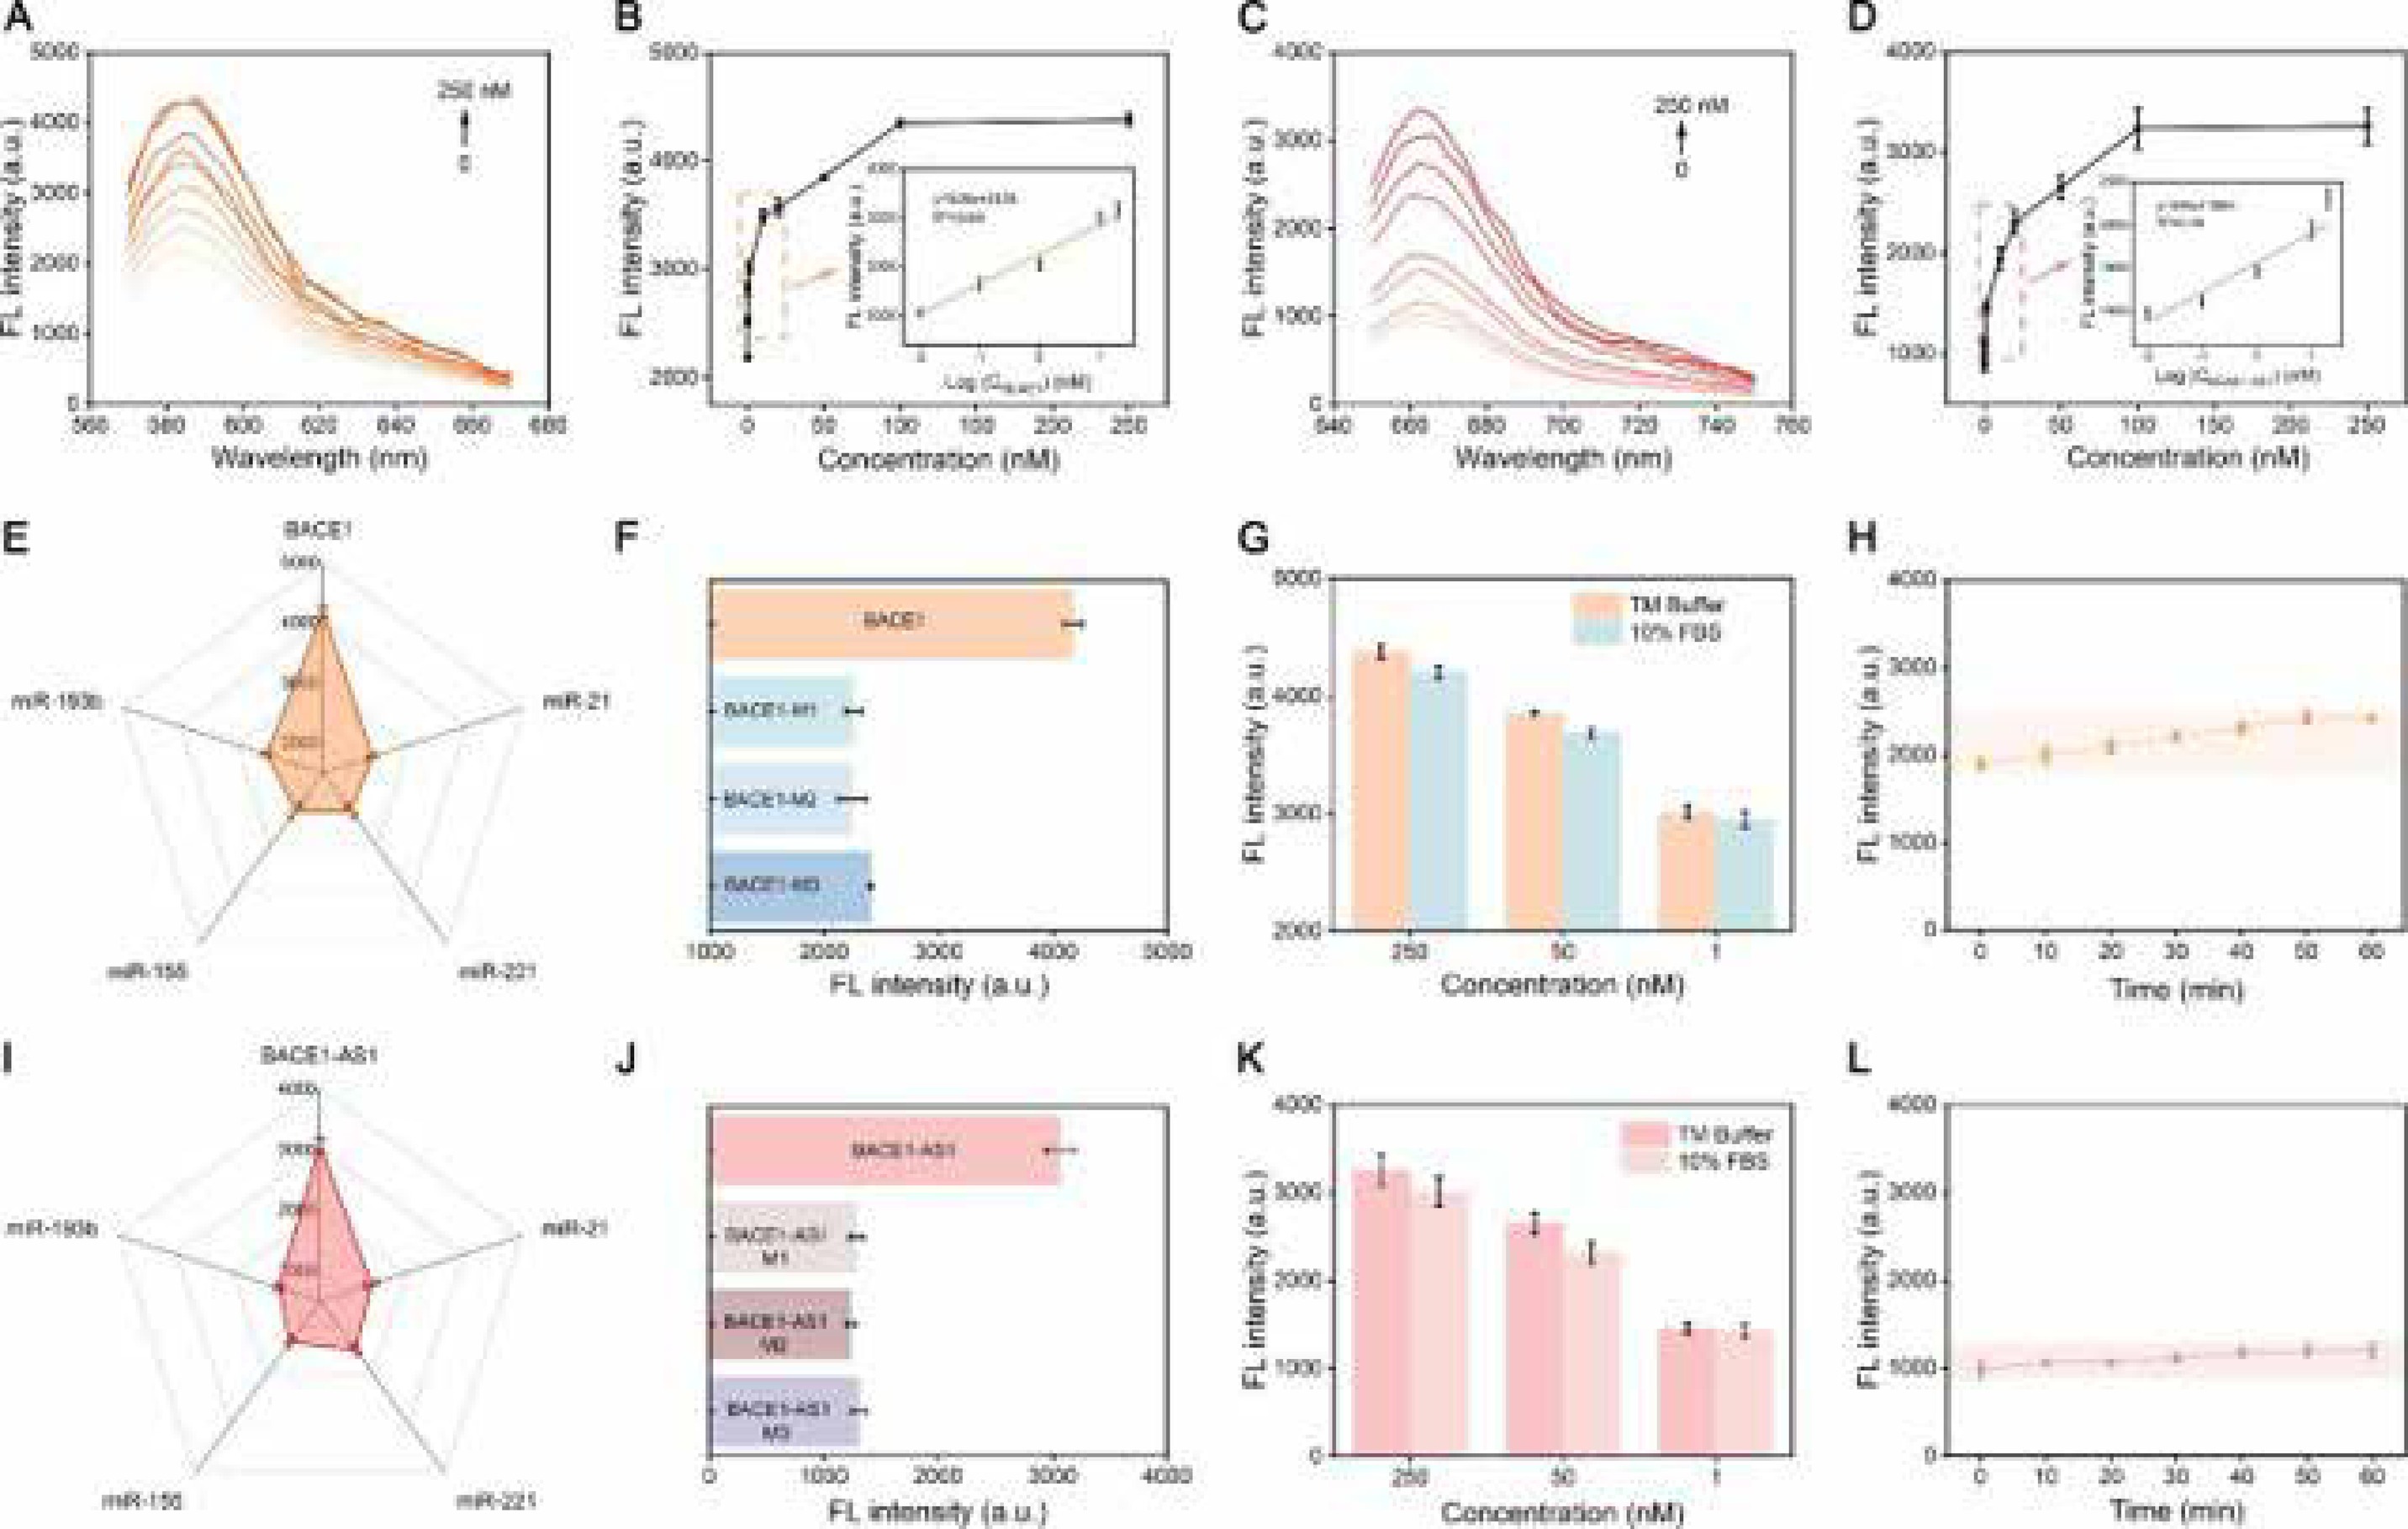
(A) Fluorescence curves for BACE1 at different concentrations (0, 0.1, 0.5, 1, 2, 5, 10, 25, 50, 100, 250 nM) with BACE1-AS1 maintained at 250 nM. (B) The linear relationship between fluorescence response and BACE1 concentration. (C) Fluorescence curves for BACE1-AS1 at different concentrations (0, 0.1, 0.5, 1, 2, 5, 10, 25, 50, 100, 250 nM) with BACE1 fixed at 250 nM. (D) The linear relationship of fluorescence response with BACE1-AS1 concentration. (E) Column charts and (F) Radar charts show selective fluorescence responses of BACE1 and BACE1-AS1, and other co-existing combinations: 2) BACE1 + miR-21; 3) BACE1 + miR-221; 4) BACE1 + miR-155; 5) BACE1 + miR-193b; 6) BACE1-AS1 + miR-21; 7) BACE1-AS1 + miR-221; 8) BACE1-AS1 + miR-155; 9) BACE1-AS1 + miR-193b; 10) miR-21 + miR-221; 11) miR-21 + miR-155; 12) miR-21 + miR-193b; 13) miR-221 + miR- 155; 14) miR-221 + miR-193b; 15) miR-155 + miR-193b (all at 250 nM). (G) The selectivity response of fluorescence toward BACE1 and BACE1-AS1, and various other mismatched RNAs (all at 250 nM). (H) Fluorescence intensities in TM buffer and 10% FBS with varying BACE1 concentrations. (I) Fluorescence intensities in TM buffer and 10% FBS with varying BACE1-AS1 concentrations. (J) Capability of the PSDN to avoid false-positive signals (FAM channel). Error bars, SD, n=3.
-
Figure 4.
(A) Fluorescence curves of BACE1 at different concentrations (0, 0.01, 0.1, 1, 10, 20, 50, 100, 250 nM). (B) The linear relationship between fluorescence response and BACE1 concentration. (C) Fluorescence curves for BACE1-AS1 at different concentrations (0, 0.01, 0.1, 1, 10, 20, 50, 100, 250 nM) (D) The linear relationship of fluorescence response with BACE1-AS1 concentration. (E) Fluorescence selective responses of the system toward BACE1 and other interfering miRNAs (all at 250 nM). (F) Fluorescence selective responses of the system toward BACE1 and other mismatched mRNAs (all at 250 nM). (G) Fluorescence intensities of three concentrations of BACE1 measured in TM buffer and 10% FBS. (H) Ability of the PSDN to avoid false-positive signals (TAMRA channel). (I) Fluorescence selective responses of BACE1-AS1 and other interfering miRNAs (all at 250 nM). (J) Fluorescence selective responses of BACE1-AS1 and other mismatched LncRNAs (all at 250 nM). (K) Fluorescence intensities of three concentrations of BACE1-AS1 measured in TM buffer and 10% FBS. (L) Ability of the PSDN to avoid false-positive signals (Cy5 channel). Error bars, SD, n=3.
-
Figure 5.
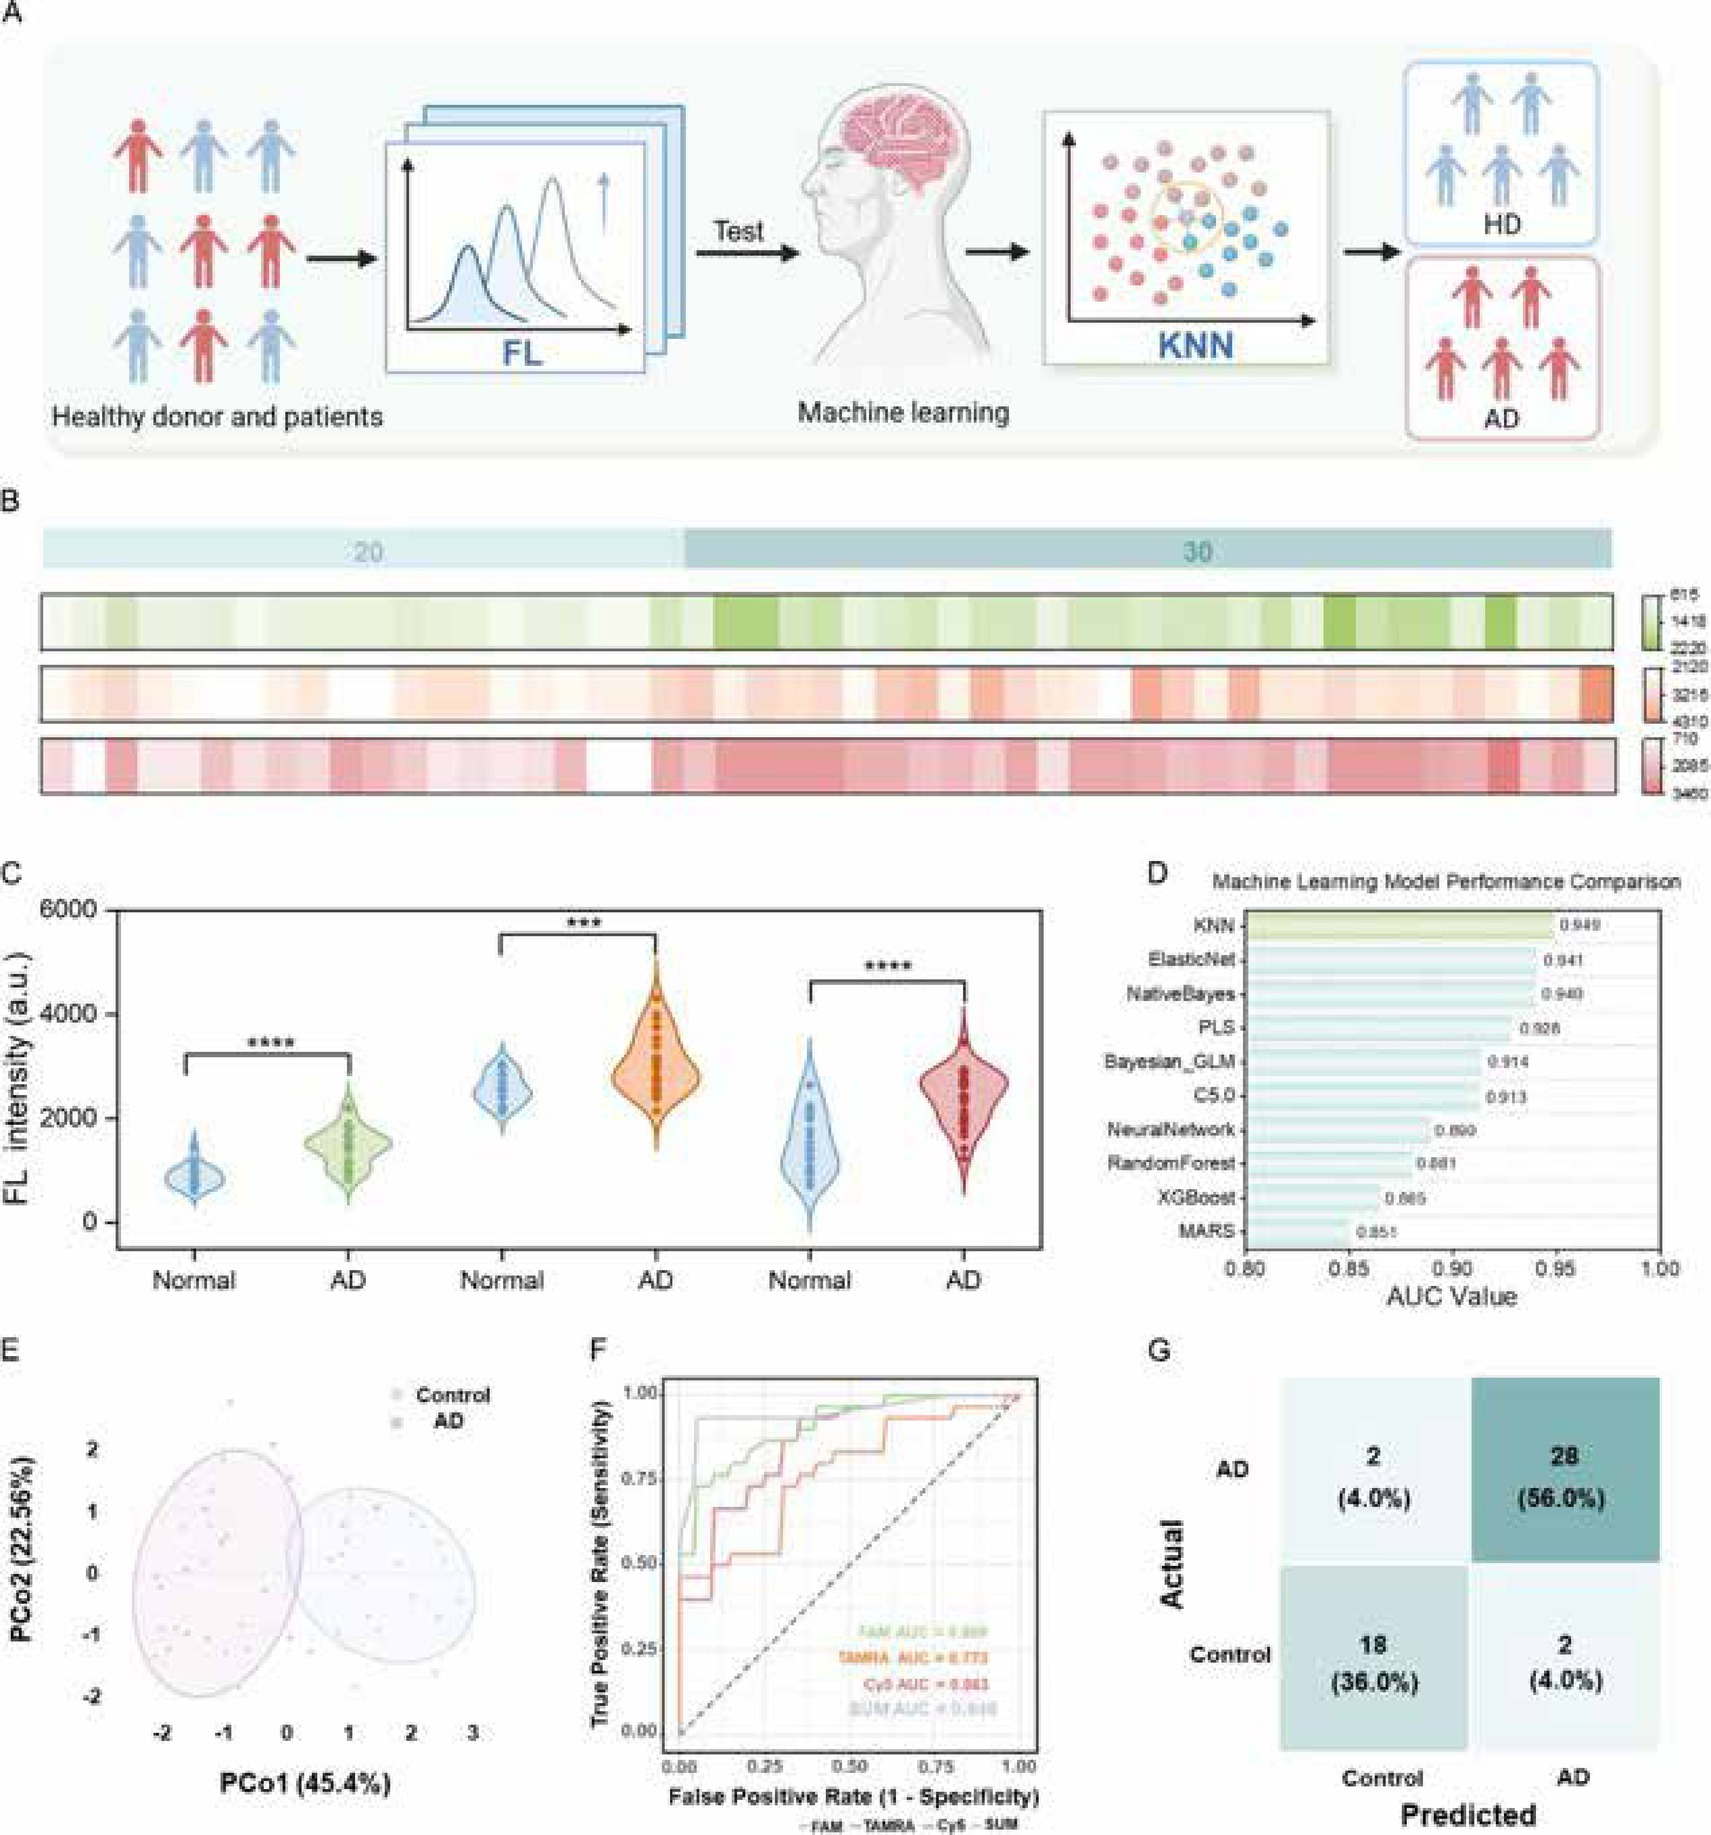
(A) Schematic of ML combined with the PSDN platform for differentiating healthy subjects from AD patients. (B) Fluorescence values measured through three channels by the PSDN in the clinical cohort are presented. (C) Violin plots of fluorescence intensities measured by the PSDN in healthy subjects among AD patients. (D) Areas under curve for ten distinct ML models are compared. AUC: area under the curve. (E) Principal Coordinates Analysis (PCoA) using the PSDN to distinguish healthy subjects from AD patients. (F) ROC analysis using the PSDN demonstrates the clinical diagnostic value of the platform in distinguishing between healthy subjects and AD patients. (G) Confusion matrix summarizing the discrimination performance of the method between healthy subjects and AD patients. *** p < 0.01, **** p < 0.0001. Error bars, SD, n=3.
-
Figure 6.
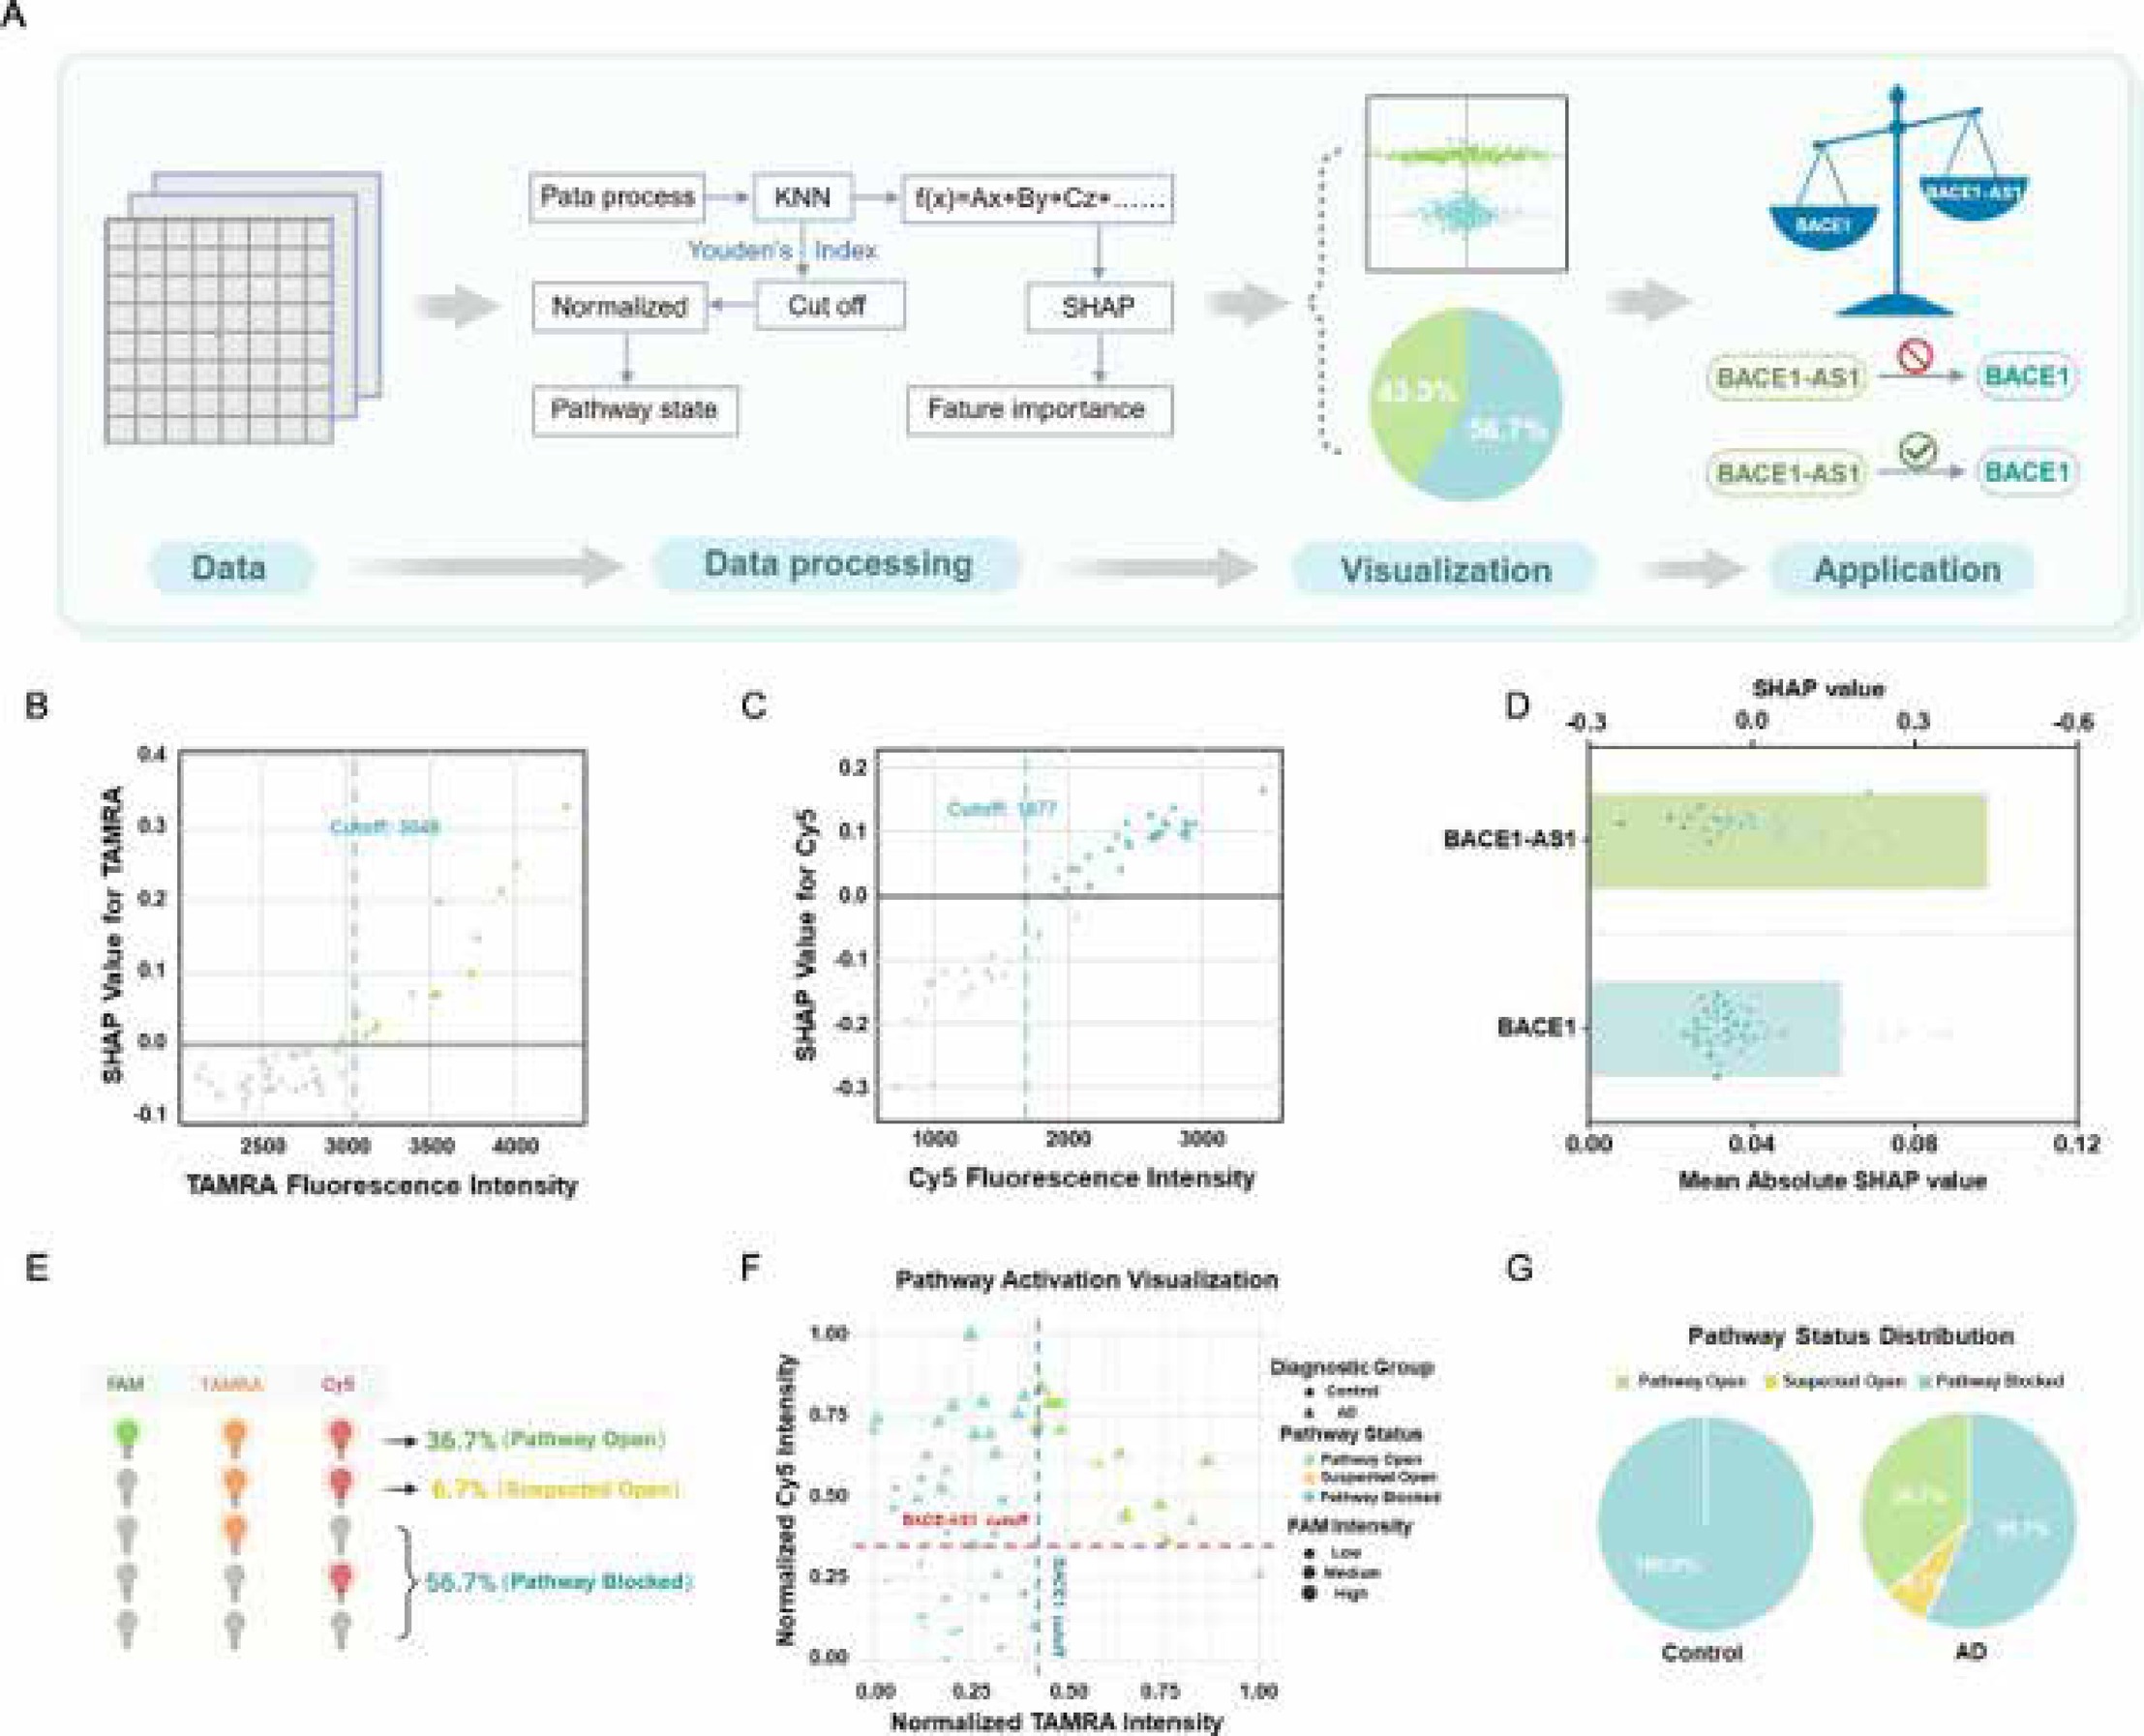
(A) Workflow for gene importance evaluation and pathway status assessment. (B) Scatter plot of BACE1 expression. (C) Scatter plot of BACE1-AS1 expression. (D) SHAP bee swarm plot. (E) Three channel fluorescence-based pathway status diagram. (F) Normalization of FAM, TAMRA, and Cy5 three-channel fluorescence signals enables visual pathway status analysis. (G) Pie chart presenting healthy subjects and AD sample status distribution.
